Research Archives - Page 5 of 6 - Cromwell Property Group
A person typing on a laptop

Research and Insights

Home Research Page 5
December 9, 2019

Suite dreams are made of these: Hotels hit the big time

Hotels have long been grouped into the category of ‘specialty’ property, alongside the likes of seniors’ living, student accommodation and even data centres. However, as investors continue to look for alternatives to the mainstay real estate sectors, the hotel market has become an increasingly acceptable option for many institutional investors.

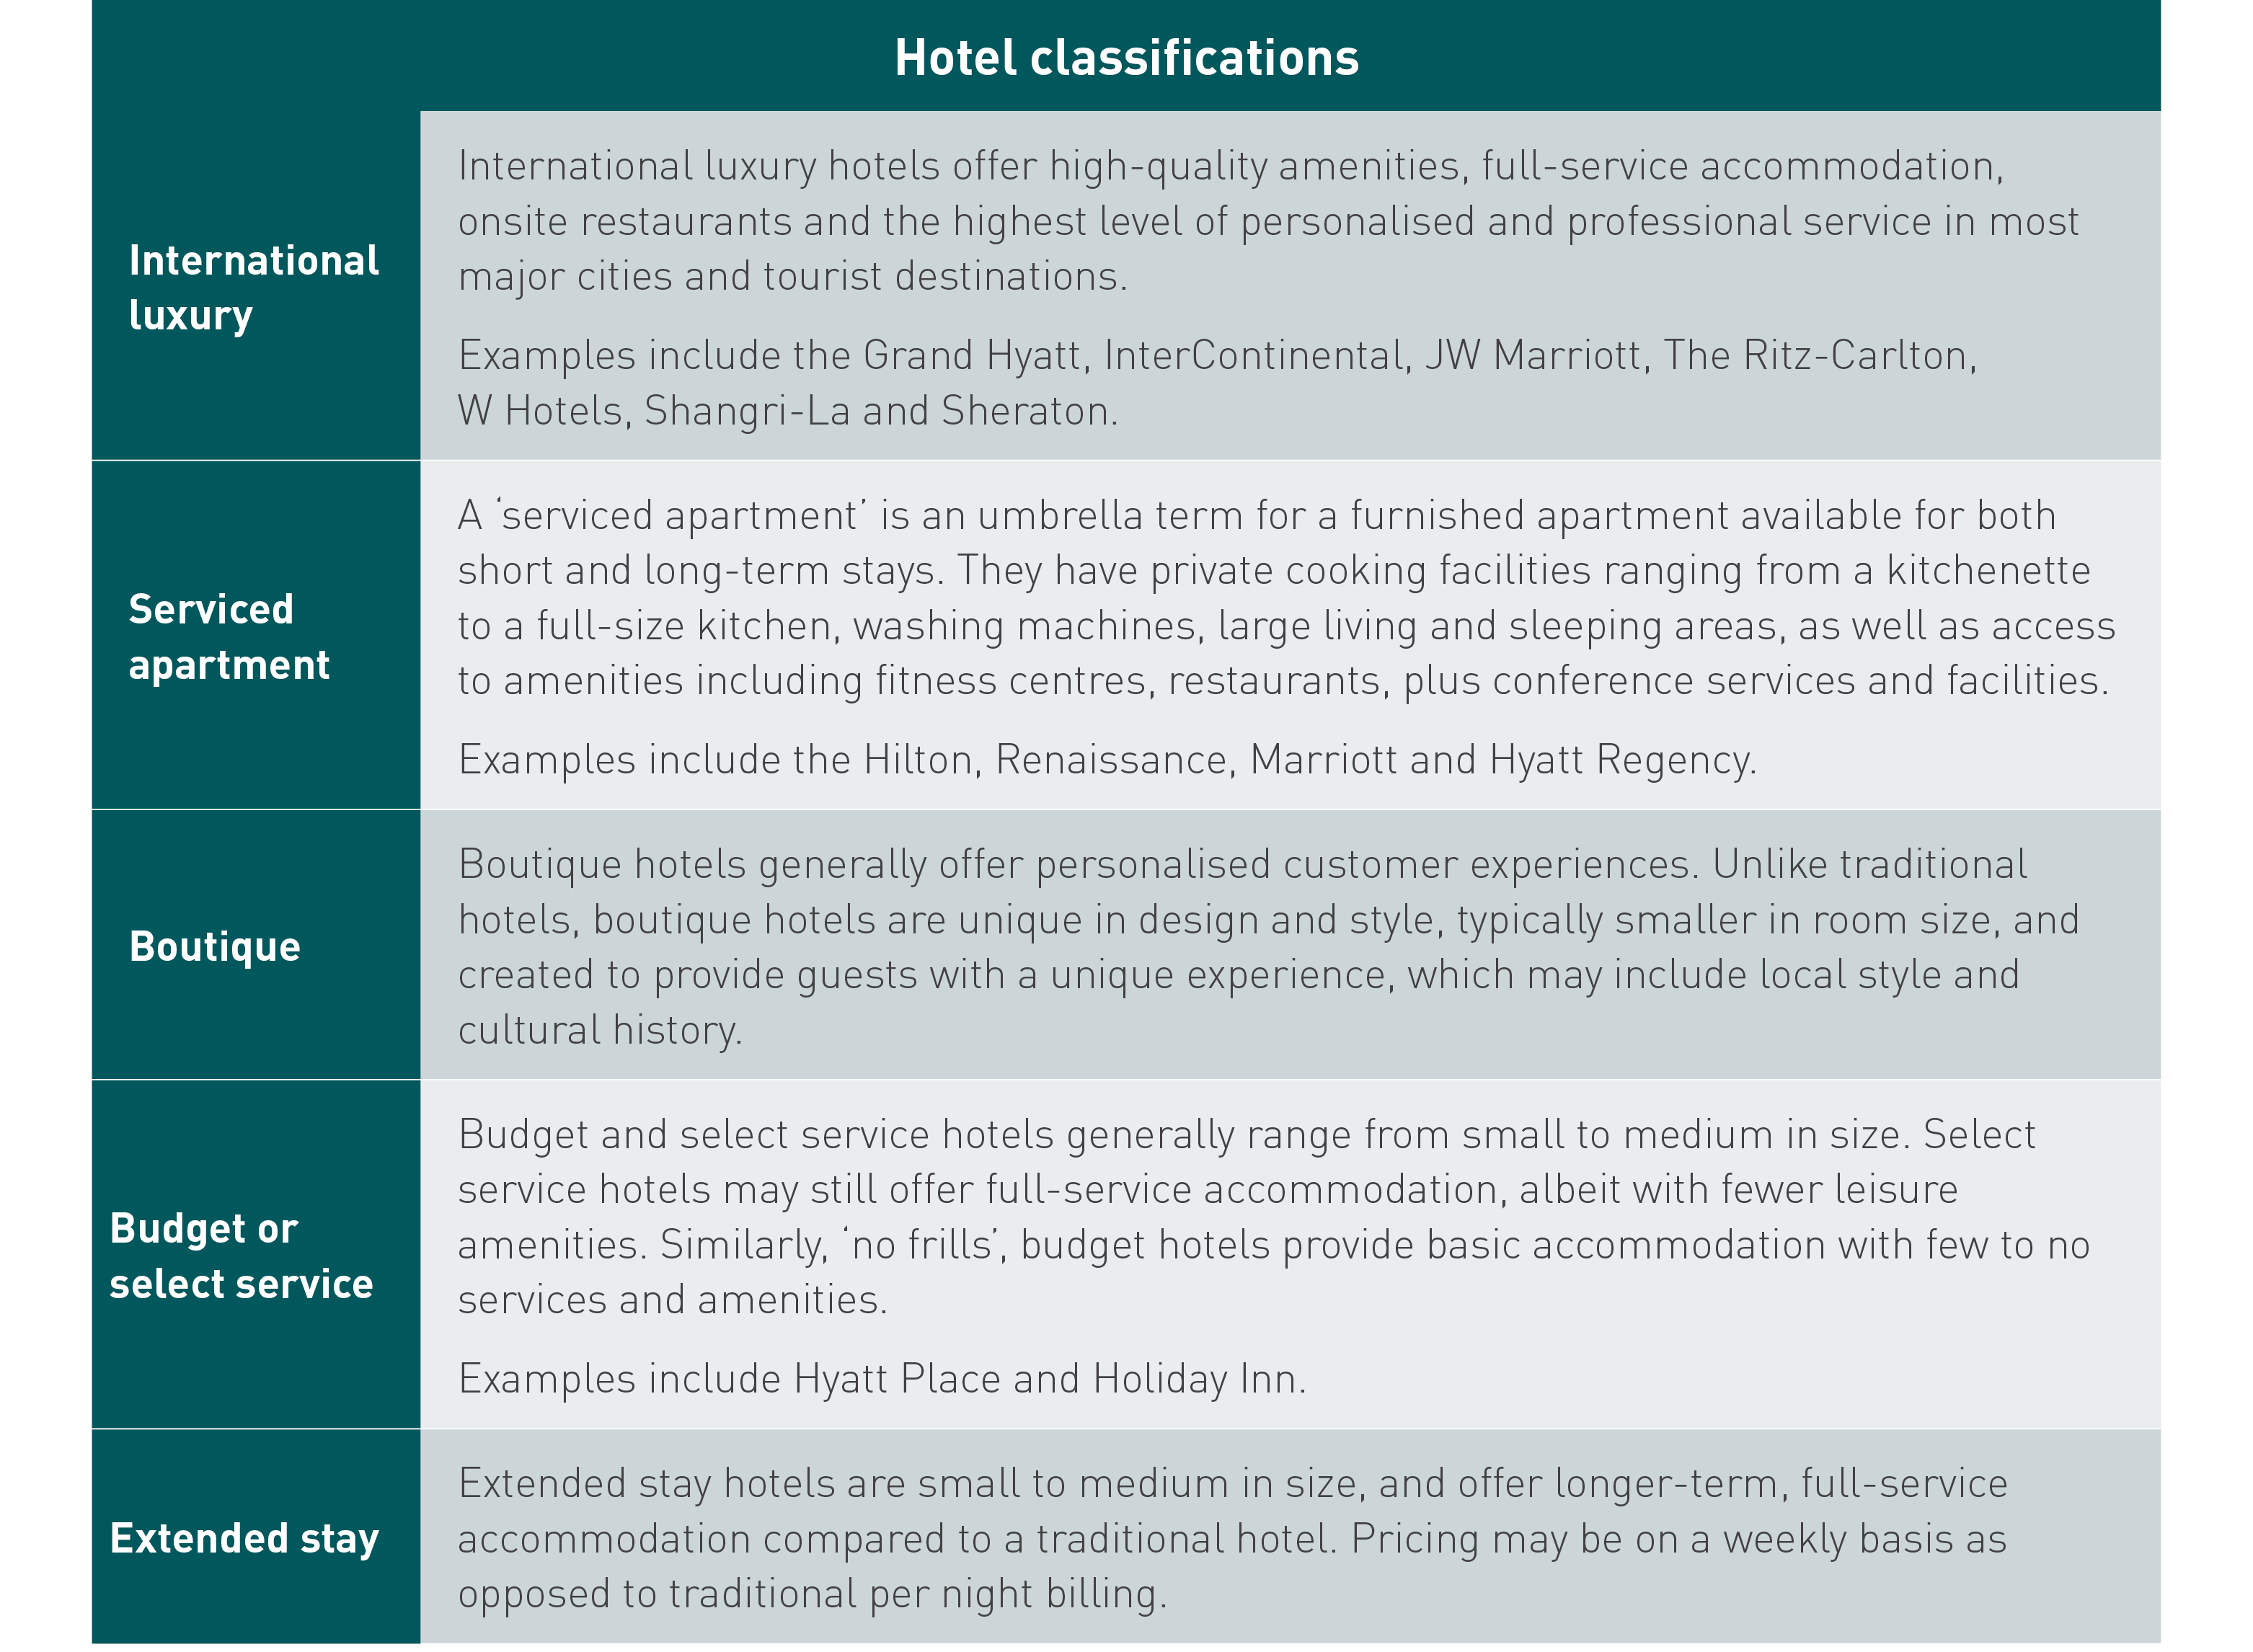
Hotel service classifications

Hotels are categorised in numerous different ways, including star ratings, size of hotel and number of rooms, location, ownership and affiliation, and also the type of hotel which is aligned to its offering.

The most common types of hotel markets include business, airport, resort or leisure, casino, convention and conference hotels.

Hotel classifications spreadsheet


Hotel dynamics

The hotel asset class possesses a number of key differences when compared to some other real estate sectors.

Owner or operator

All hotels require an operator, but whilst the operator and underlying investor (or owner) can be one and the same, particularly for boutique hotels, this is not necessarily always the case.

Many larger branded or chain hotels tend to have a mix of several ownership types including direct ownership, management contracts or franchise arrangements. For example, just because the name says Hilton, does not mean the Hilton Company owns the property.

Hotel rooms are perishable goods

A hotel room, like an airline seat, is a perishable good. That is, once a specific date occurs, every room not booked for that night perishes. Similar to airline seats, there is no market for yesterday’s rooms.

This presents a challenge as every hotel obviously wants as many rooms as possible booked each night, albeit the temptation is often to discount the room. Ongoing discounting, however, can damage a hotel’s brand and lead to other challenges.

Pricing fluctuates greatly

Hotel prices are put through a rigorous prediction process. Pricing rooms is not as simple as knowing when peak and off-peak seasons are. Rather, the hotel looks at the past year’s demand and compares it to larger trends correlating with the wider hotel industry. These include the economy of the country in which the hotel is situated, competitors’ prices for similar rooms, and even weather patterns.

A hotel will also look at its booking history. In doing so, the hotel seeks to identify the ‘booking curve’ in order to understand the optimal number of rooms that should be booked at certain intervals in advance (generally one, two and/or three months).

The overarching goal for every hotel is to ensure the most rooms are booked per night, at the highest price possible. As such, during stretches of lower demand or if actual bookings are lower than projected, room prices can be decreased to incentivise last-minute booking. On the other hand, prices are generally raised when demand is high.

Booking platforms are important

Online booking platforms have become an important tool to ensure the greatest possible number of rooms are occupied on a nightly basis, particularly when demand is low during off-peak times.

Third party agency sites such as Booking.com act as an intermediary between guests wanting to make a reservation and a hotel. These platforms also have a broader reach compared to a hotel’s own website, so while they can direct additional bookings to a hotel, they also charge for the privilege. This, in turn, eats into the hotel’s profit – hence why hotels usually advertise that the best rate is obtained by booking direct.

Loyalty programmes

Almost every major hotel chain has a loyalty programme to encourage travellers to stay with their chain wherever they travel across the globe. Similar to airline loyalty schemes, their hotel counterparts offer varying levels of membership and rewards for staying with a particular chain, or group of hotels.

Global hotel market summary

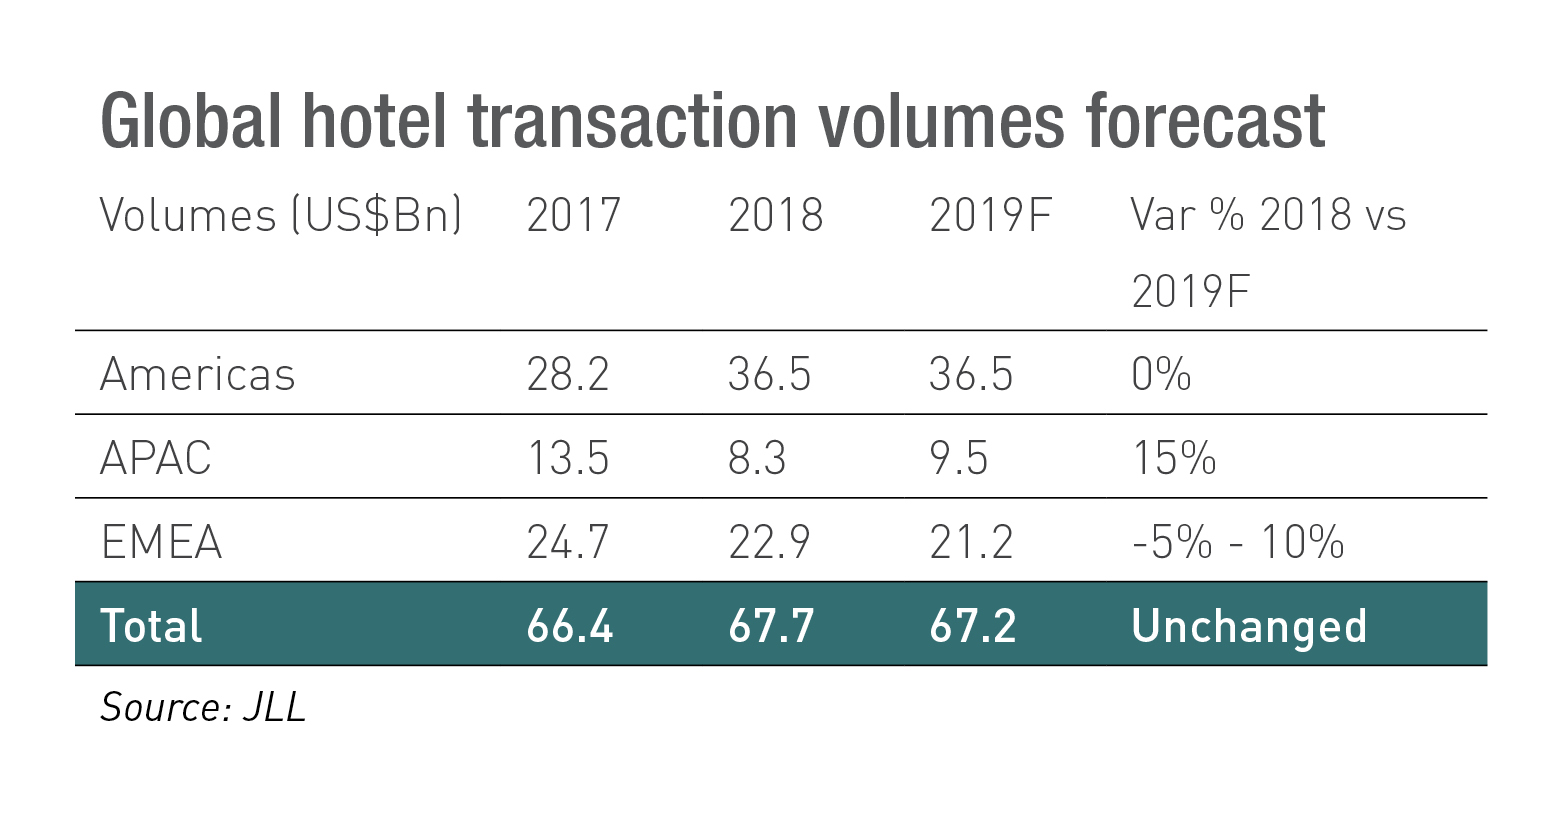
While slower global economic growth is expected to provide a headwind, hotel investment volumes are expected to hold steady in 2019 as a result of pressure to deploy capital, hotel occupancy and room rates remaining positive and the attractive yield profile hotels generally offer compared to other sectors.

Volume in the Americas is expected to be flat, while an increase in Asian markets is expected to offset a slight decline in Europe. It is expected that total transaction volumes will be US$67.2 billion, essentially unchanged from 2018’s US$67.7 billion.

Global hotel transaction volumes forecast spreadsheet

Europe

Single-asset deals are expected to dominate in the near term. The lower volatility in the return profile of hotels reduces the volatility of funds, while slightly increasing the returns. As such, hotel assets provide a stabilising effect to the diversified funds to which they are added.

Overall, transaction volumes are anticipated to drop between 5% and 10% on 2018, to just over US$21 billion. However, the sentiment towards the asset class remains largely positive, as demonstrated by the acceleration in hotel development activity.

Germany and the UK account for nearly 60% of rooms under construction across Europe. These two markets are expected to absorb the additional supply across the medium term off the back of the strong tourism growth forecasts.

In 2018, Europe received the largest amount of cross-border investment, largely attributed to Asian and Middle Eastern investors. The region is expected to remain an active destination, particularly from Asian investors who are keen to take advantage of currency benefits.

Asia Pacific

Diverse sources of core and core-plus capital are increasingly weighing up investment into hotels. Japan is one of the most active markets due to the Rugby World Cup and Tokyo 2020 Olympics, but China and Singapore are also on investors’ radars, with the positive trend in hotel trading performance set to drive prices upwards.

APAC activity is expected to see a 15% year-on-year increase in 2019, although transaction volumes will still be a modest US$9.5 billion.

All eyes on Japan

Through the first half of 2019, Japan’s hotel market recorded the highest domestic transaction volumes in Asia Pacific at US$1.14 billion. Japanese REITs accounted for almost half of this investment, with demand rising off the back of low borrowing costs and expectations of continued market growth as a result of large-scale events such as the 2019 Rugby World Cup, Tokyo 2020 Olympics and the 2025 World Expo.

The Rugby World Cup is responsible, in part, for the 12% increase in international visitors forecast to descend on Japan throughout 2019. It is reasonable to anticipate an even greater increase in 2020, as 10 million visitors are expected to attend the Olympic Games.

Even though Tokyo will have 170,000 rooms in 2020, up from 30,000 in 2017, a number of prominent hotels are already hanging ‘no vacancy’ signs for the Games, illustrating continued strong demand for at least the next few years.

Americas

In the US, large portfolio deals are expected to dominate investment. Transaction volumes across the Americas in 2019 are forecast to meet the $36.5 billion mark set in 2018. Despite no year-on-year growth, this is still up significantly on the region’s US$28.2 billion transacted in 2017.

2018 represented the tenth consecutive year of growth in North America’s hotel performance, although it appears as though the development pipeline has reached its peak and begun to slow. This has resulted in increased confidence amongst investors, particularly in major markets such as New York.

Key growth drivers and future trends

Mixed-use: Work, stay, play

Mixed-use buildings, combining hotel, residential, office and/or retail space in a single building or precinct have gained increased traction in recent years. Mixed-use buildings increase diversification for investors and allow them to blend their offerings to meet the increasing demands of their guests.

Millennials moving in

Demographics are a major consideration for all hotel investors and operators. In Australia, millennials on average spend the most on accommodation per night. This gives rise to an emerging challenge, particularly given the growing rise of Airbnb amongst this demographic. Hotels must create a point of difference to ensure they continue to attract customers in the face of this popularity.

Rise of the global middle class

The rise of the global middle class also shows no signs of slowing, increasing from 1.8 billion people in 2009, to a forecast 3.2 billion in 2020 and 4.9 billion in 2030. The bulk of this growth comes from Asia, which will represent two-thirds of the global middle-class population by 2030. As a result of this rapid rise, the sheer number of people looking to travel, and stay at a hotel, is growing quickly.

The experience economy

Consumers are also placing less emphasis on acquiring material goods, and more on seeking out experiences. This is particularly evident in the global luxury travel market, which is forecast to reach US$1.1 trillion by 2025, representing a compound growth rate of 4.3% between 2017 and 2025.

This growth is driving demand for hotel stays and investors are looking to capitalise. In 2018, the US saw luxury hotel transactions rise by 76% year-on-year. In Europe, investors are looking to deploy capital to meet this demand in key destination cities such as Paris, Rome and Florence.

Investor diversification

Investors are also seeking alternative options to the traditional real estate sectors of office, industrial and retail to diversify their returns. As pressure mounts to deploy capital, the positive longer-term dynamics continue to heighten the appeal of hotel assets. Across the five years to 2018, 70% of hotel investments were made by investors looking to diversify, rather than those seeking hotel-specific funds.

Hotels, like any other asset class, have positives and negatives as an investment option. However, there is a lot to like about the sector, including its ability to diversify investor portfolios and sustained medium-term growth in demand off the back of the experience economy, tourism boom and continued rise of the global middle class.

Hotel infinity pool with two people looking at the view of the city

A person typing on a laptop

Research and Insights

Home Research Page 5
December 9, 2019

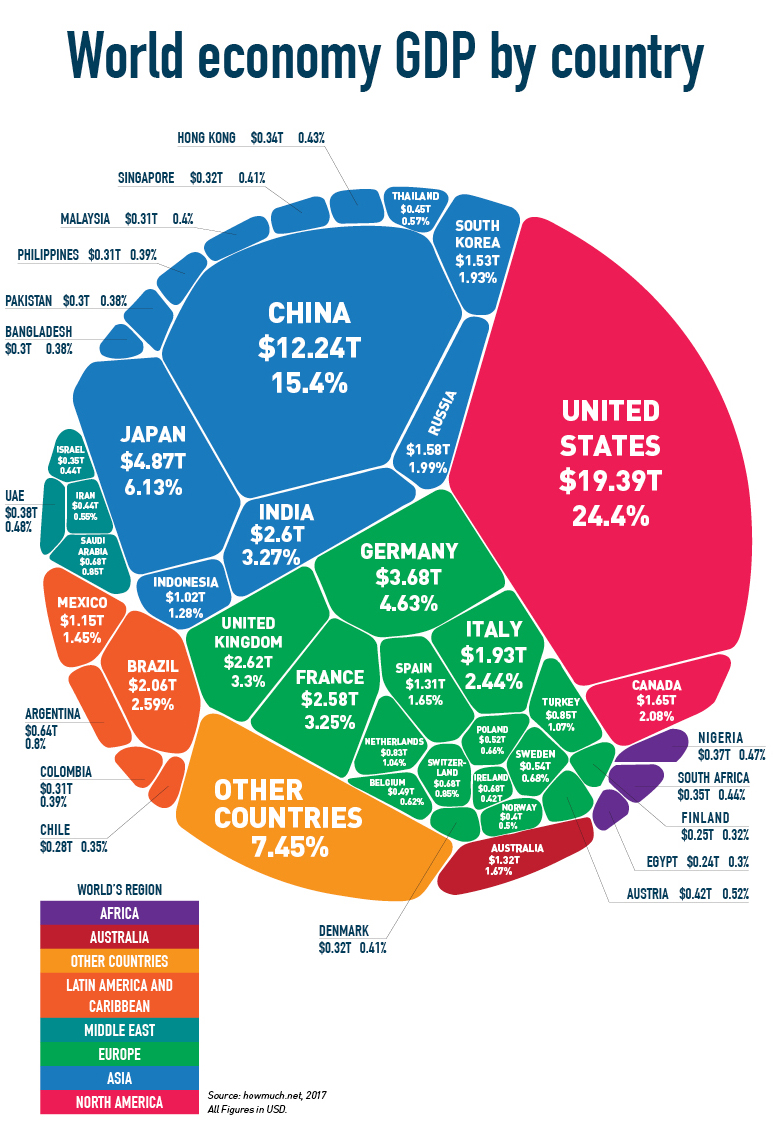
The US$80 trillion world economy at a glance

The infographic below shows the composition of the US$80 trillion global economy in 2017, the most recent year in which comprehensive figures were available. In nominal terms, the US still has the largest Gross Domestic Product (GDP) at US$19.4 trillion, making up 24.4% of the world economy, nearly 60% larger than China at US$12.2 trillion.

However, in 2016, the International Monetary Fund called the Chinese economy the world’s largest when adjusted for purchasing power parity (which allows you to compare how much your money can buy in relative terms).

Perhaps a more telling statistic is that per capita disposable income is US$39,513 in the US and just US$2,993 in China. This more aptly illustrates just how far China has yet to go to give its citizens a similar quality of life.

The next two largest economies are Japan (US$4.9 trillion) and Germany (US$4.6 trillion). It’s India (US$2.6 trillion), however, which has now passed France and, given Brexit, probably also the UK, which is increasing the fastest. Brazil, despite its very recent economic woes, surpassed Italy in GDP rankings to take the number eight spot overall. Canada rounds out the top ten.

Australia’s GDP was US$1.32 trillion or 1.67% of the global economy, which just about puts it on par with Spain. While punching above Spain and most others in terms of GDP per capita, Australia remains a relatively small economy in global terms.

The infographic below shows the composition of the US$80 trillion global economy in 2017, the most recent year in which comprehensive figures were available. In nominal terms, the US still has the largest Gross Domestic Product (GDP) at US$19.4 trillion, making up 24.4% of the world economy, nearly 60% larger than China at US$12.2 trillion.

However, in 2016, the International Monetary Fund called the Chinese economy the world’s largest when adjusted for purchasing power parity (which allows you to compare how much your money can buy in relative terms).

Perhaps a more telling statistic is that per capita disposable income is US$39,513 in the US and just US$2,993 in China. This more aptly illustrates just how far China has yet to go to give its citizens a similar quality of life.

The next two largest economies are Japan (US$4.9 trillion) and Germany (US$4.6 trillion). It’s India (US$2.6 trillion), however, which has now passed France and, given Brexit, probably also the UK, which is increasing the fastest. Brazil, despite its very recent economic woes, surpassed Italy in GDP rankings to take the number eight spot overall. Canada rounds out the top ten.

Australia’s GDP was US$1.32 trillion or 1.67% of the global economy, which just about puts it on par with Spain. While punching above Spain and most others in terms of GDP per capita, Australia remains a relatively small economy in global terms.


Why diversify?

Australia has often been called the lucky country, given its more than 25-year run without recession. Luck, however, is not a strategy, nor is it sufficient to build a business, execute a strategy or pay distributions. Luck can run out and, diversification, whether or not it’s for personal investing or growing a business, is important.

Diversification doesn’t mean turning your back on what you know or are familiar with (Australia), but it does mean prudently assessing opportunities which can diversify investment portfolios or business income streams both by sector and by geography.

The European real estate market, for example, comprises approximately 350 million sqm of office stock, over 14 times more than the Australian equivalent. The market comprises more than 34 different individual office markets, each with more than 2 million sqm of office space.

To put it in perspective, that’s 34 different markets the size of Brisbane or Canberra that you can choose to invest in. All of these locations will have different local market dynamics, are at different points in the real estate cycle and are in differently performing countries, some of which, like Poland, currently have better prospects than Australia. Diversification matters.

 

World economy GDP by country

A person typing on a laptop

Research and Insights

Home Research Page 5
December 9, 2019

The importance of catchment in retail

In Insight 27, we provided an overview of the changes currently being experienced by the retail sector globally. The retail landscape varies dramatically from country to country. However, across all borders and economies, understanding the importance of catchment is vital.

Catchment refers to the sphere of influence from which a retail location – for example, a shopping centre – is likely to draw its customers. The general concept of a retail catchment area comprises three major considerations – supply factors, demand factors and consumer interactions.

On the supply side, there is the strength of the offering in terms of a centre’s quality, age, size, location and tenant mix. Alternatively, demand factors include location, population and demographic makeup of the catchment area. The supply and demand factors, in turn, dictate consumer interactions. A centre with a better offering will draw consumers from greater distances than centres with few points of difference to its competitors.

There are, however, a number of other important catchment-related considerations. Firstly, the position of a retail centre within the hierarchy of other local retail centres. This is determined by the format and size of the centre, population density of its catchment, the competitive intensity, and how well its proposition fits the needs of the consumer base.

For example, a high-end boutique centre with luxury fashion retailers would more than likely fare poorly in a low socio-economic area.

Generally, a catchment with a large population will have a greater retail offering, to the extent it acts as an employment hub and economic driver, thereby attracting customers from a wider area. A smaller, or remote catchment, will more than likely serve a different function, be more embedded in local economies and be patronised more frequently by local communities.

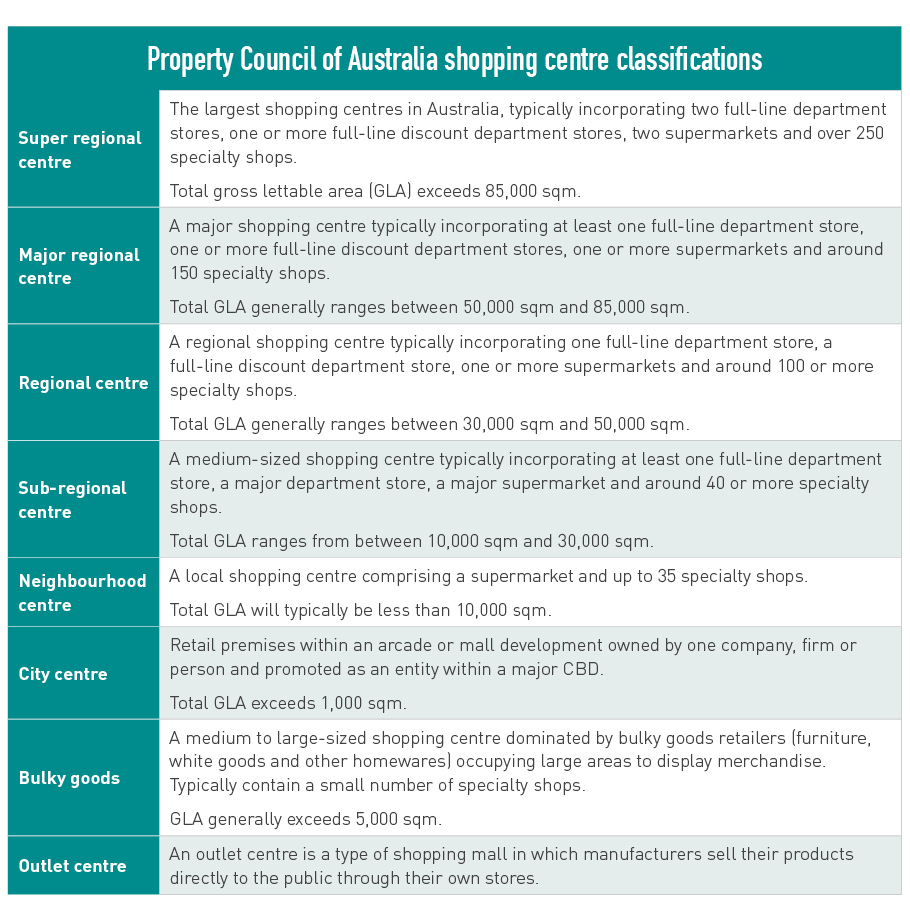
In Australia, the Property Council of Australia sets out classifications for shopping centres, which are closely aligned to the concept of ‘catchment’. This is shown below.

The importance of catchment cannot be overlooked. It is vital shopping centre investors and managers understand their catchment area in terms of socioeconomic status, size and demographics, and are able to tailor their offering accordingly.

Property Council of Australia shopping centre classifications spreadsheet

A person typing on a laptop

Research and Insights

Home Research Page 5
December 9, 2019

Australian economic and property outlook

Global economic outlook

World gross domestic product (GDP) growth slowed over the last year, but there are some signs that momentum is turning. Central banks have relaxed monetary policy since the start of 2019, Chinese authorities have intervened to support domestic growth momentum, the tariff wars may prove less destabilising than originally thought, and expansionary fiscal policy has been implemented across many key Asian markets.

Global growth is projected to be around 2.9% p.a. on average over the next five years, although Australia’s trading partners’ economies are forecast to grow at 3.8% over the same period. Long-term GDP growth, however, will be structurally weaker than in the past due to slower population growth and more limited improvements in productivity.


Australia’s economic outlook

GDP growth remains weak, at 1.4% for the 12 months to 30 June 2019. The key factor remains subdued household consumption. Although lower interest rates and income tax cuts are generally supportive, the Australian consumer seems to have their hands firmly in their pockets.
Residential building has turned down sharply and is likely to be a large drag on growth until late- 2020. Conditions remain conducive to a pick-up in business investment, as monetary conditions are accommodative and utilisation rates are high, but deteriorating confidence and some remaining uncertainty around the global outlook is causing firms to take pause.

Mining investment will trough soon, however, and the absence of any drag will support growth. Underlying export demand continues to be strong and will contribute around 2.1% of GDP growth for FY19 and FY20 before stronger growth of around 3% thereafter.

Employment growth also remains healthy, but price pressures are weak and wage growth is only slowly trending higher. The RBA lowered the cash rate by 25 basis points in June, July and October and is likely to pause now with the cash rate at a record-low 0.75%.


Office markets

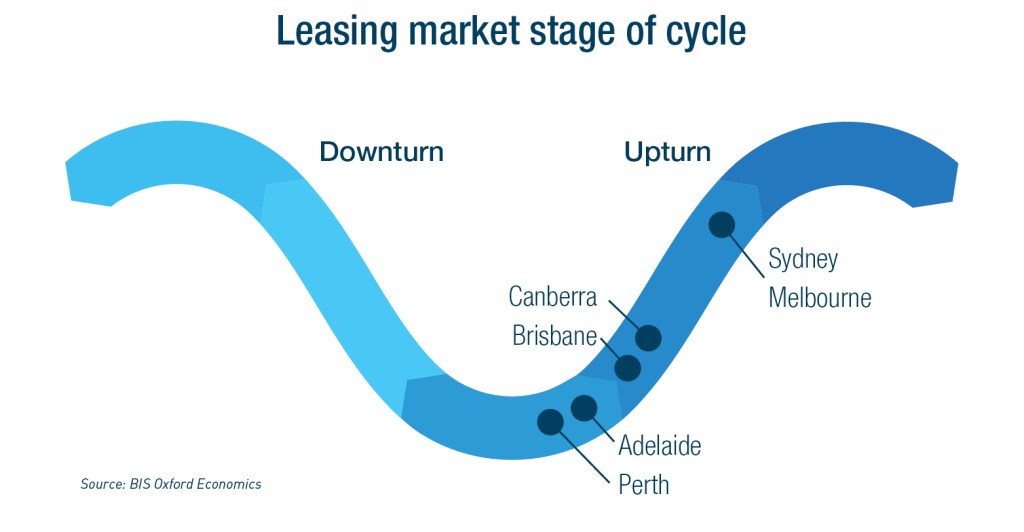
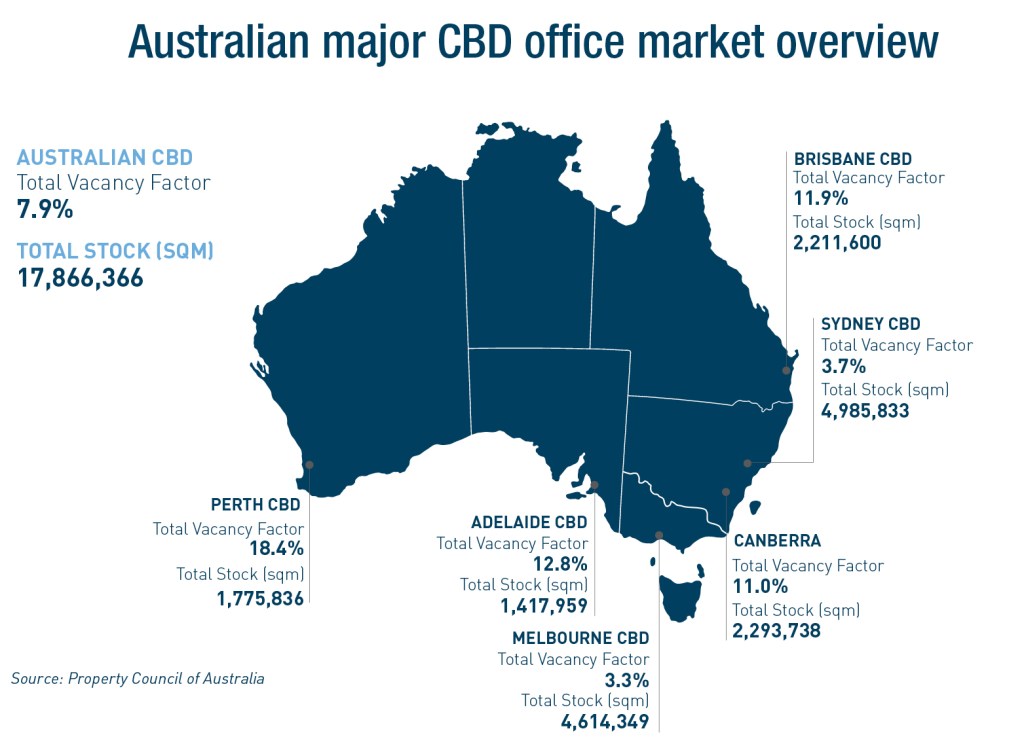
Australia’s major office markets are at different stages of the office cycle. CBD vacancy rates range from 3.3% in Melbourne to 18.4% in Perth. Sydney and Melbourne have the tightest leasing markets and offer strong rental growth prospects over the next five years. They also offer the best five-year investment returns, albeit the ten-year returns are much lower.

For the other major capital city markets, the converse is true. Ten-year returns eclipse five-year returns, reflecting stronger leasing conditions further out in the cycle. In Brisbane, Perth and Adelaide, we are past the trough in the cycle, but recovery in demand will be slow and it will take time for vacancies to fall.

In Brisbane, new supply could delay the recovery. In Canberra, the A-grade market is tight and returns will be solid over the medium to longer-term, but the market remains strongly driven by the requirements of government.


Industrial market overview

Australia’s eastern seaboard industrial property markets continue to experience strong occupier and investor demand. Construction of new space is struggling to keep pace with demand, leading to declining vacancy rates and, particularly in already built-up areas, putting upwards pressure on rents.

Meanwhile, the sector has delivered strong capital gains over the past five years. Most of that has been the result of firming yields, with rental growth only recently joining the equation. The resulting investment returns were amongst the strongest of all property investment classes in Australia over the past 12 to 18 months.


Retail sector outlook

The retail property market in Australia continues to face difficult conditions. The pace of retail turnover growth is weak from a long-term historic perspective. Data indicates 2.4% year-on-year growth, reflecting the volatility of the sector. The pattern of soft turnover growth is consistent with soft wages growth and weak consumer sentiment.

In the investment market, activity has slowed and, with more sellers than buyers, yields have started to soften for all centre types bar regional centres.

There are numerous examples of properties being sold for below book value or last valuation. We are likely to see further softening of non-core centre yields as investors increasingly question an asset’s income growth prospects.


The outlook for property returns

Investment returns from commercial property across Australia over the next five years will be well below those achieved over the past five years. The strength of recent returns was, for the most part, the result of falling bond rates driving firming yields, often completely out of lock-step with leasing fundamentals. The weight of money chasing investment property fuelled the fall.

Across most capital cities and sectors, yields have continued to firm over the year. Indeed, with bond rates reaching new lows, we have pushed back the expected timing of a turnaround (rise) in bond rates and associated yield softening, although the medium-term direction is unlikely to change.

Near term, yields could continue to firm modestly. There is still a significant differential between yields on offer for Australian property and those in Asian city markets, and both local and international investor demand for Australian property remains strong.

Moreover, most property markets that experienced oversupply following the end of the mining investment boom are now in a recovery stage of the cycle.

Industrial yields appear to offer the greatest scope for near-term firming. By contrast, retail yields (other than for regional centres) are showing signs of softening in response to risks around centre income returns.

As such, we expect office yields in Sydney and Melbourne to soften only once rentals start to decline in about five years. In the smaller city markets, where yields have firmed despite weak leasing conditions, there is a greater risk of yields softening in line with bond rate movements.

Many investors, institutional and private, will struggle to meet current hurdle rates of return on a five-year investment horizon. Lease expiry profile and vacancy risk will be critical, as will be value-add development opportunities. Investors may need to consider either a shorter, or alternatively a longer-term, time horizon for investments to stack up.

A person typing on a laptop

Research and Insights

Home Research Page 5
October 1, 2019

UK office market: Steady despite headwinds

Joanna Tano


Activity, from both occupiers and investors, in the UK’s office sector recorded a relatively positive Q2 amidst the continued Brexit haze. While political uncertainty has tempered market activity, deals are being done, prime yields are at, or close to, historic lows, supply-strapped markets are seeing an uptick in headline rents and the resilience of the UK office market is evident.

Addressing the uncertainty of Brexit head on, there were inevitably some companies who decided to move some of their operations away from the UK when the outcome of the 2016 Brexit Referendum was announced. Further, there are some that have decided they cannot live with the continued delay to the outcome of Brexit and have relocated some staff. Finally, there are some companies that are looking at their structures and where their personnel are based and restructuring, unrelated to Brexit.

However, there are some, possibly overlooked headlines of positive job creation and investment banks buying their headquarter buildings. This further demonstrates the resilience of not only London, but the UK market as a whole. Unemployment is at its lowest level in a generation, which is finally seeing some real wage growth. Immigration levels might be lower than in the recent past, but the working-age population will still expand through natural increases and further rises in the state pension age.

The UK is in a leading position in several service sectors such as financial and business services. Additionally, according to JLL’s ‘Innovation Geographies’ report, London has the highest concentration of talent in the world due to its leading universities and a highly-educated workforce.

GDP growth is expected to reach 1.3% in 2019, stronger than the Eurozone average, suggesting a subdued but nonetheless encouraging level of confidence in the economy given the political situation and lack of a definitive outcome of Brexit. The latter will continue to deter some business investment until the UK’s future trading relationship with the EU becomes clearer, but businesses must continue to operate and cannot, therefore, take no action.

Investor appetite for the UK


The UK real estate market offers size, diversity of product, depth of investors and breadth of occupiers all of which contribute to its appeal. Additionally, liquidity, transparency and high-quality stock in large lot sizes makes it one of the most significant markets in Europe.

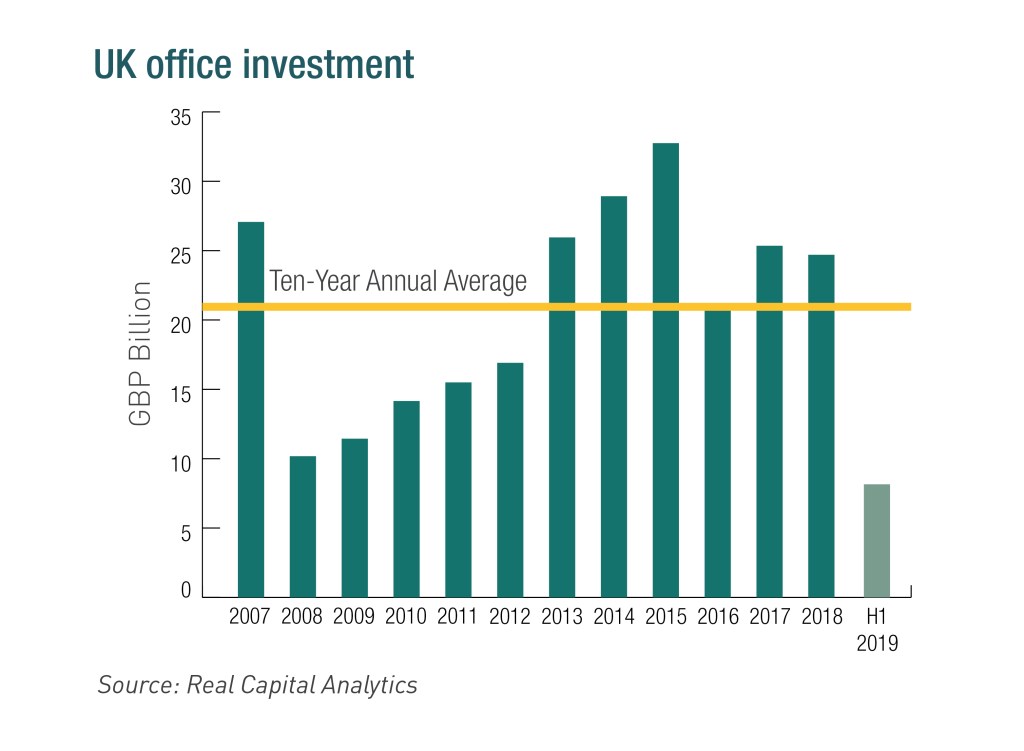
In 2018, over £60 billion transacted, approximately 20% above the ten-year annual average. Both 2017 and 2018 trading volumes were above those of Brexit-year 2016, unlike the dramatic falls in activity following the GFC in 2008, after which volumes took at least five years to recover to pre-crisis levels.

In 2018, the office sector accounted for a 40% share of activity. £8.2 billion was invested into UK offices in H1 2019 – mirroring the expected slowdown following the decision to extend the Brexit deadline to October, and partly due to the flurry of deals that closed in the final quarter of 2018.

With limited distress evident and vendor expectations on pricing remaining high, some deals are being held back. There is, however, a noted rise in risk-aversion among some investors given the political landscape. Due diligence is tending to take longer as the market has reached a mature stage of the cycle, which is also impacting on lower investment volumes.

Simply, investors are taking a more considered approach. There is some, albeit limited, evidence that yields are beginning to soften in some secondary markets, which will present opportunities for investors willing and able to take a possible capex, long-term position.

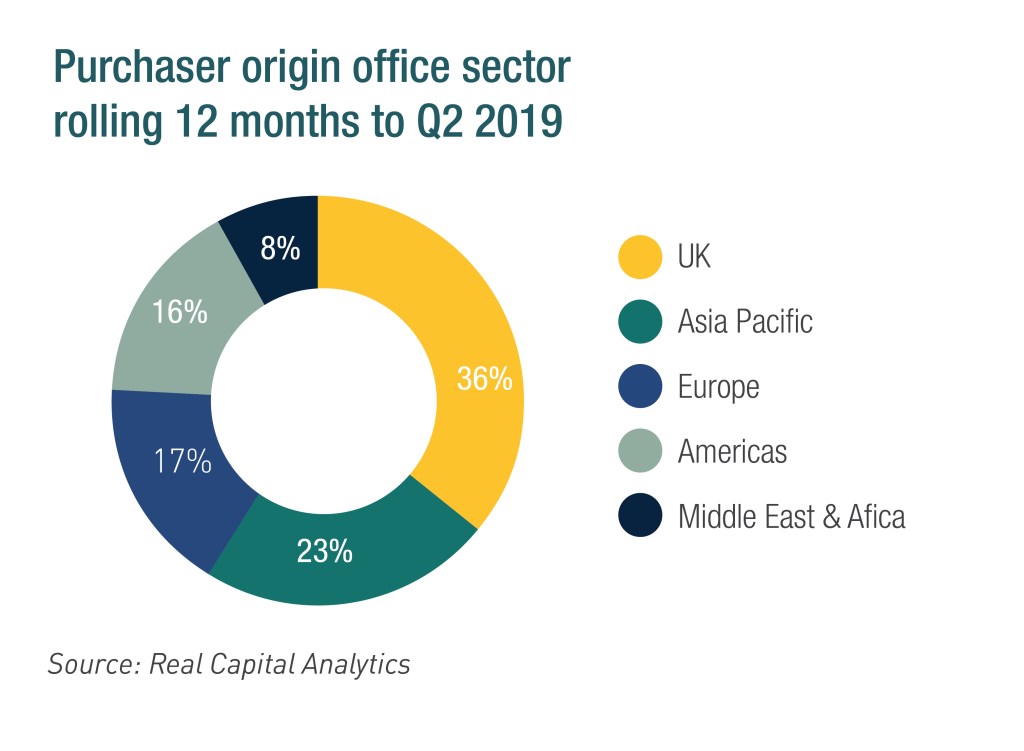
The investor base remains broad, and looking back over the past 12 months, domestic buyers remained active (36%) with Asian buyers the next largest group, specifically capital from Singapore and South Korea. Different capital sources are seeing opportunities in different areas.

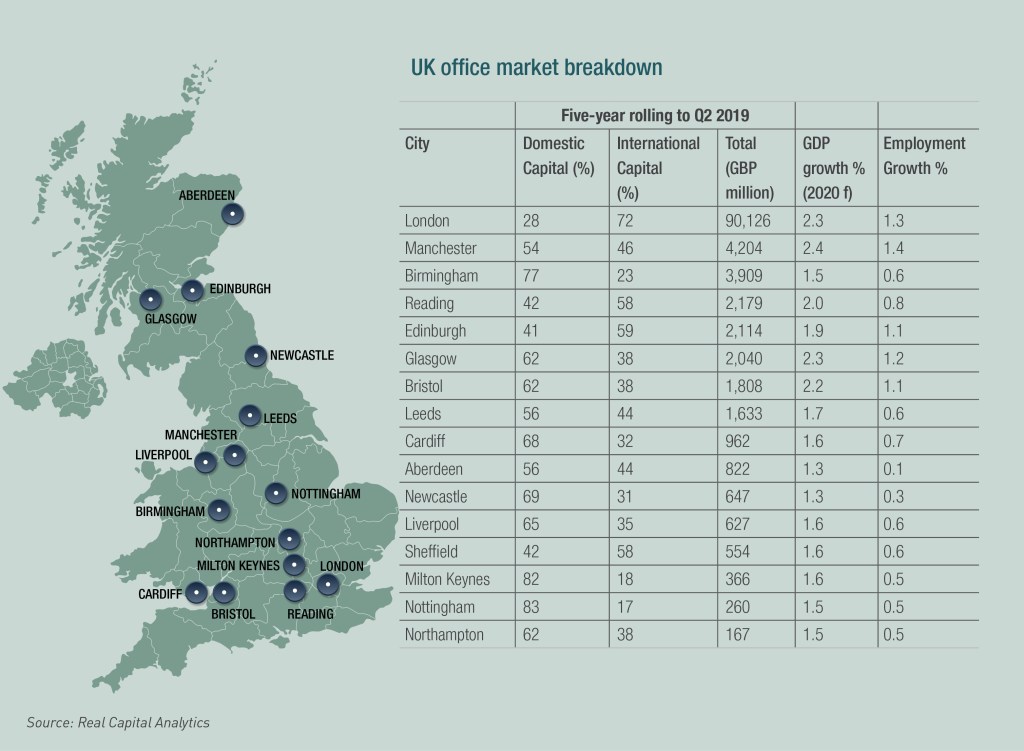
London, Europe’s leading gateway city, retains its crown in the UK office market, consistently attracting around 75% year-on-year of total capital inflows into the office sector. Manchester and Birmingham round out the top three spots. Private equity is more attracted to value-add opportunities with a focus on London, while longer-term capital such as Korean, is buying into the growth story of the stronger performing regional cities.

What’s happening in the occupational market?

Fundamentals are robust by and large, with performance primarily driven by the lack of supply across key centres and supporting rental growth, especially at the quality end of the market. Development activity is increasingly constrained, with pipelines limited in a number of key locations. This does, however, present opportunities for the redevelopment and repositioning of secondary stock as companies continue their ‘flight-to-quality’ strategies.

Vacancy in London is 4.25%, having declined since the beginning of the year despite a slower Q1 2019 in terms of take-up, with Q2 seeing a more robust performance. More stock is coming through, with an estimated 13.2 million square feet (1.2 million sqm) under construction, but this is unlikely to dramatically impact the level of availability as around 55% has already been let or is under offer.

Active demand is also holding up well against the political headwinds, and at approximately 3.7 million square feet (344,000 sqm) is above the ten-year average of around 3.0 million square feet (279,000 sqm), suggesting the slower start to the market is not here to stay and a pick-up in activity will follow in the coming months.

With that said, there are further reasons for optimism. Both the professional services and technology sectors are forecast to account for the majority of London’s GDP growth in the next five years, which should translate to a need to increase headcount. Oxford Economics highlights other positives for London, including the continued high performance of London’s universities and colleges, an unusually young population, flexible labour market, and relatively easy access to finance. These strengths should help counteract the negative impact from Brexit as well as the threats to the global economy.

Regionally, 2.34 million square feet (217,000 sqm) of space was let in Q2 across the ‘Big Nine’*, bringing the half-year total to 4.3 million square feet (399,000 sqm), 10% above the long-term average. Activity was heavily focused on larger deals, quality space in city centres and flexible space. The technology sector was very active while there was a retraction from traditional sectors such as financial, professional and business services.


What are landlords doing? Flexible working

Landlords need to be creative and flexible. The way that office space is being used is changing, and owners and investors need to be open and responsive to these changes while looking to preserve income streams. The war on talent continues and the need for companies to tap into talent pools and having them accessible to transport infrastructure is increasingly important, as is the need to provide services and amenities in the office that were unheard of ten years ago.

Technological advancements, supporting the changing needs and lifestyles of employees and facilitating the rise of small businesses, as corporates strive to facilitate a productive workforce, are boosting the need for flexible space. In addition, the desire from larger corporates to have space they can expand into and divest from at short notice is more prevalent in today’s world than ever before.

Co-working space is gaining prominence amongst flexible operators. Conventional landlords are making a move to enter the market as well, rather than simply rent their buildings to flexible operators, they are looking to take a share of the profits.

Flexible workspace providers remain an important driver of leasing activity, accounting for 15% – 20% of office take-up in the UK capital over the past three years. The UK is also an important and growing market for flexible workspace solutions, with the concept being increasingly adopted with new entrants to the market alongside the established providers. Currently an estimated 5.1% of Central London’s office stock is occupied by flexible workspace operators, up from just 0.8% in 2008.

Given their success in meeting the needs of their customers, this trend is here to stay.

Conclusion

The UK may not be for all investors at the moment, but there are opportunities to be had. The UK continues to attract capital despite the backdrop of political uncertainty and a slower economic environment. For those that are taking a longer-term view and can see through the noise, supply constraints and a lack of speculative development remain key drivers of performance.

While transaction volumes are down, loan-to-value ratios and debt levels are lower than before the GFC, meaning any disruption due to Brexit is likely to be relatively limited, particularly for long-term investors.

A person typing on a laptop

Research and Insights

Home Research Page 5
October 1, 2019

Brisbane: The new world city

Jack Green


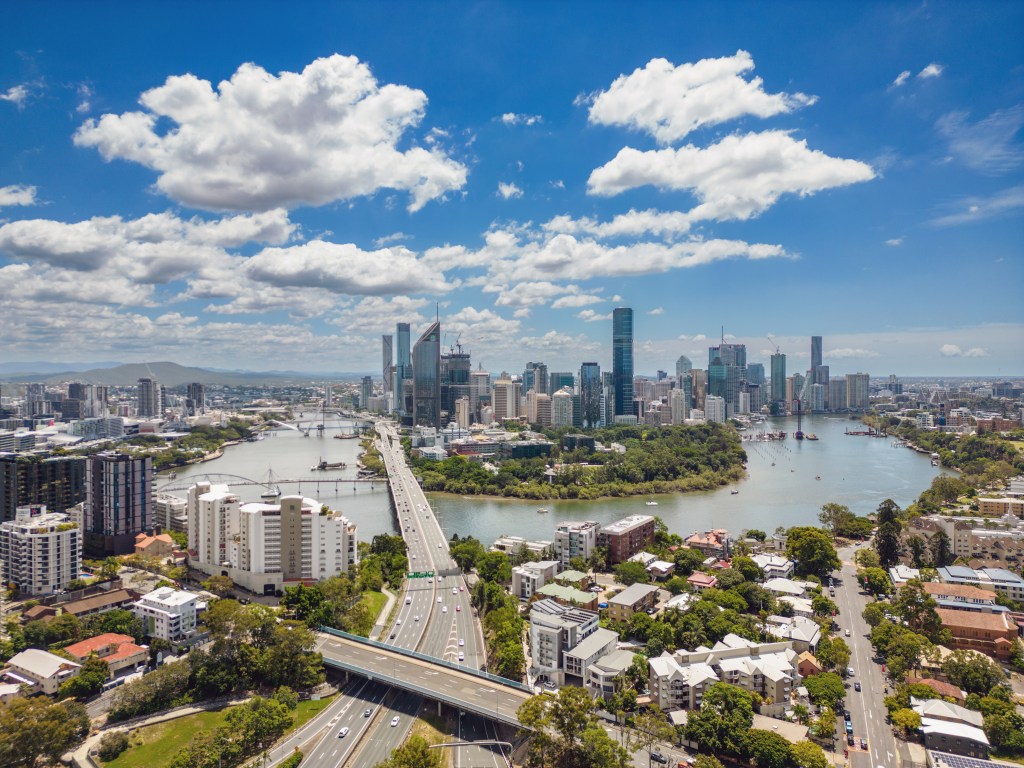
Brisbane continues to transform itself into a self-titled ‘new world city’. It is a destination for both domestic and international real estate investors off the back of Queensland’s improving economic growth and a multibillion-dollar infrastructure pipeline.

Where does Brisbane sit in the Australian commercial real estate market?

Brisbane CBD comprises over 2.2 million sqm of office stock, making it just under half the size of the Melbourne CBD and slightly smaller again when compared to Sydney. Its vacancy, however, is a lot higher, albeit on a downward trajectory having dropped to 11.9%, from 12.9% just six months previously. Brisbane fringe vacancy contracted from 15.7% to 13.8% over the same period.
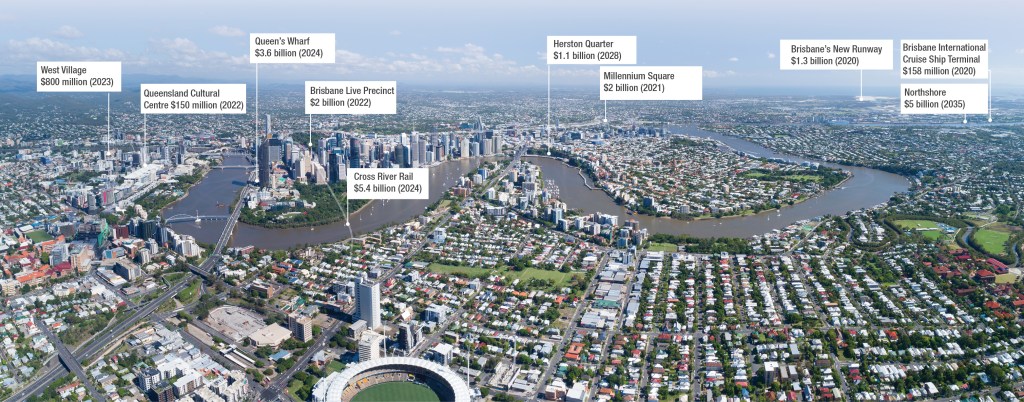
This improvement indicates Brisbane is continuing to recover from its record-high vacancy rates after the end of the mining boom. The 11.9% Brisbane CBD vacancy rate is currently the lowest it has been since early-2013, indicating strong sentiment regarding the ‘River City’. This sentiment is amplified given the fact that Perth, the other major resource-driven office market, continues to struggle, with vacancy at 18.4% and incentives upwards of 50%.

Queensland’s economic fundamentals are mixed. According to CommSec’s July 2019 State of the States Report, Queensland ranks fifth in Australia in terms of overall economic performance, despite having the nation’s third best relative economic and population growth.

The State of the States Report, however, does not incorporate Gross State Product, a category in which Queensland (3.4%) outperformed the Australian average (2.8%) in 2018. Queensland’s unemployment rate is 6.0% at present, above the national average of 5.1%.

Overall, the Queensland economic outlook seems able to withstand weakening global and domestic conditions, particularly as a weaker currency is a positive to growth in key sectors such as resourcing, tourism and international students. Additionally, the reduction in housing construction has been offset by increased commercial construction and business investment in and around the Brisbane CBD.

Office outlook

A turnaround in the Brisbane CBD office market is slowly emerging, with an optimistic outlook for the remainder of 2019 and beyond. It is reasonable to anticipate the state’s economy will continue to pick up and investment sentiment to increase off the back of Australia’s weakening dollar. Significant public infrastructure investment and steady population growth will also help.

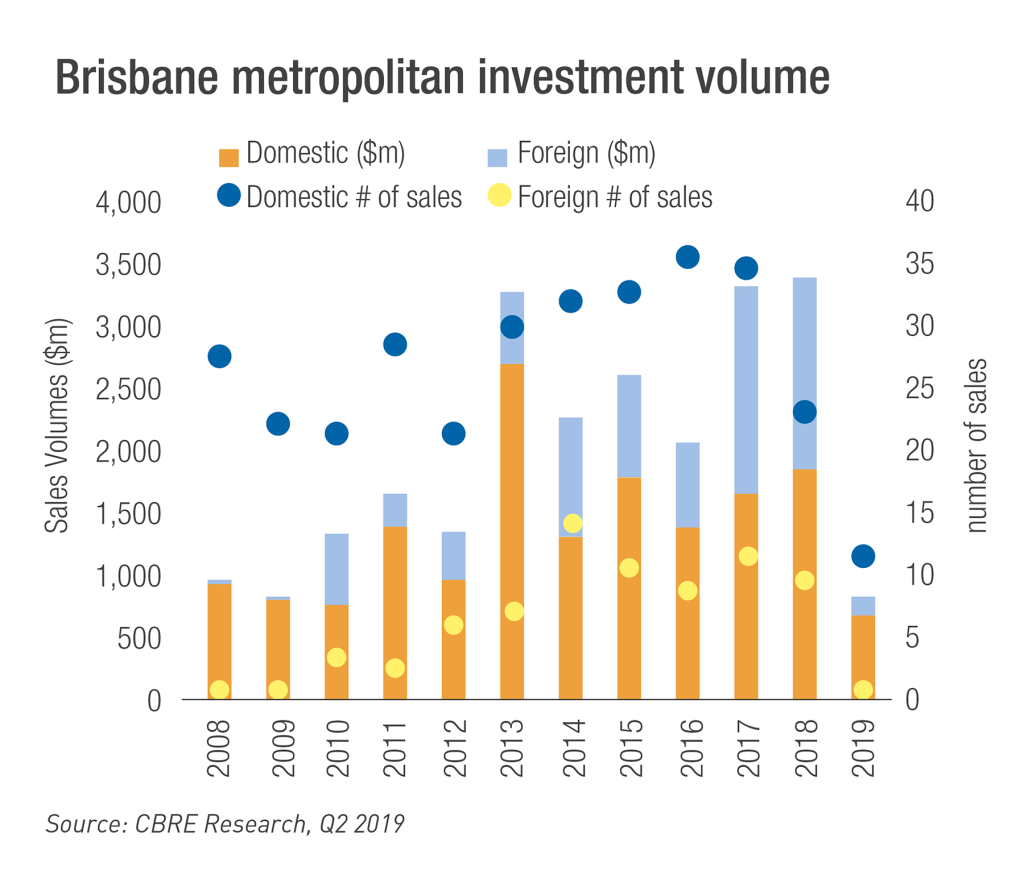
Investors seeking higher yielding assets have been looking at the Brisbane market for a while now, with 2019 on track to be a record year in terms of investment. The estimated volume of sales, either settled, pending or under due diligence, reached approximately $2 billion through the first half of the year. Only the limited availability of stock seems to be a hindrance for investors.

Rents appear likely to continue to edge upwards as vacancy drops, dictated by a positive combination of relatively low new supply and stronger tenant demand.

This should drive some further tightening of capitalisation rates as domestic and offshore investors continue to take advantage of the yield discrepancy between Brisbane, its southern counterparts and also comparable international city destinations.

One potential negative, however, is the proposed Queensland Government land tax change. This continues to be lobbied against by the industry but, if legislated as is, is likely to negatively impact foreign investors. On top of increases to existing land tax rates, which now range from 1.7% to 2.75%, a new proposed land tax foreign surcharge of 2% will apply to foreign companies.

Why Brisbane?

International destination

Brisbane is one of Australia’s primary tourist destinations, with its array of restaurants, galleries and shopping, but it also acts as a gateway to everything else Queensland has to offer. The Great Barrier Reef, Whitsunday Islands and rainforests of Far North Queensland are a short flight away, while the Gold Coast and its famous beaches are within driving distance.

In 2018, Queensland’s international visitor count for the year grew 2.3% to 2.8 million. The weak Australian dollar is helping drive an increase in tourism, with international tourists flocking down under, as well as nationals forgoing an international holiday to travel domestically.

It’s not just tourism drawing international visitors to Brisbane. With seven world-class universities and a number of private schools accommodating international students, it is no coincidence international enrolments in Queensland educational facilities rose 9.1% in 2018.

Liveability

When measured against cities across the world, Brisbane is attractive for its liveability.

In 2019, The Economist ranked Brisbane 18th out of 150 cities worldwide, based on the criteria of stability, infrastructure, education, healthcare and environment. Mercer, which uses similar yet more extensive criteria, placed Brisbane at number 35 out of 231 cities evaluated in their 2018 Quality of Life index.

Relative value

Along the east coast of Australia, Brisbane’s residential market is comparatively well placed. As at March 2019, the median apartment value in Brisbane was $372,900, whilst Melbourne was $466,900 and Sydney a whopping $696,900. Similarly, for houses, Brisbane holds an average price of $563,700, while Melbourne’s $809,500 and Sydney’s $1.03 million sit far higher.

Those priced out of the residential market in the southern cities can find value in Brisbane.

Brisbane is well placed within the wider Australian commercial market, and has an abundance of infrastructure projects in the works. It is little wonder the ‘River City’ is becoming an increasingly popular destination for international real estate investors.

Project Cost Estimated Completion Description
Cross River Rail $5.4 billion 2024 Set to be utilised by more than 160,000 commuters daily, the 10.2-kilometre rail line between Dutton Park and Bowen Hills will consist of almost six kilometres of tunnel beneath the Brisbane River and CBD.
Northshore $5 billion 2035 With construction beginning in 2020, and spanning an area of 302 hectares, Northshore will be Queensland’s largest urban renewal project, consisting of high-end apartments, commercial space, retail, restaurants and bars.
Queen’s Wharf $3.6 billion 2024 The 26-hectare integrated resort development will consist of five new hotels, as well as 50 bars, restaurants and cafes, a pedestrian bridge to Southbank, and is expected to draw an additional 1.39 million visitors to Brisbane each year.
Brisbane Live Precinct $2 billion 2022 The Brisbane Live Precinct, located in Roma Street, will centre around a new 17,000-seat arena.
Millennium Square $2 billion 2021 Millennium Square, located in Bowen Hills, is touted as the ‘city within a city’. It will consist of a state-of-the-art multimedia hub, residential towers, entertainment facilities and one-hectare garden.
Brisbane’s New Runway $1.3 billion 2020 Brisbane’s New Runway is currently the largest aviation construction project in Australia. Once complete, Brisbane will have the best runway system in Australia, and current aircraft capacity will effectively be doubled.
Herston Quarter $1.1 billion 2028 Linking old with new, Herston Quarter is set to become one of the nation’s largest and most complex biomedical precincts. The redevelopment is set to showcase the area’s local heritage, as well as provide aged care and retirement living, and residential accommodation.
Brisbane Metro $944 million 2023 Construction has begun on Brisbane Metro, which will be a key part of Brisbane’s greater transport network, connecting the city to the suburbs.
West Village $800 million 2023 Located on the fringe of Brisbane’s CBD, West Village will include seven residential buildings and about 13,000 sqm of retail and commercial space, alongside one hectare of open space linked by pedestrian and cycle laneways.
Brisbane International Cruise Ship Terminal $158 million 2020 South-east Queensland currently does not have a dedicated facility able to accommodate mega cruise ships. However, once complete, the Brisbane International Cruise Ship Terminal will be able to cater to the largest vessels in the world.
Queensland Cultural Centre $150 million 2022 The new development at Southbank will serve as the Queensland Performing Arts Centre’s fifth theatre, and will in turn make QPAC the largest performing arts centre in Australia.
A person typing on a laptop

Research and Insights

Home Research Page 5
October 1, 2019

The changing face of retail

Jack Green


For investors and operators alike, the phrase ‘traditional retail’ currently invokes feelings of uncertainty and dread, and there is a level of panic associated with the demise of brick and mortar retail. But is the fear of the so-called ‘retail apocalypse’ warranted?

Not all retail is created equal

The retail landscape varies dramatically from country to country. The United Kingdom is the home of high street retail, where the United States is the land of not only the free, but also the shopping mall and has more shopping space per person than anywhere else in the world.
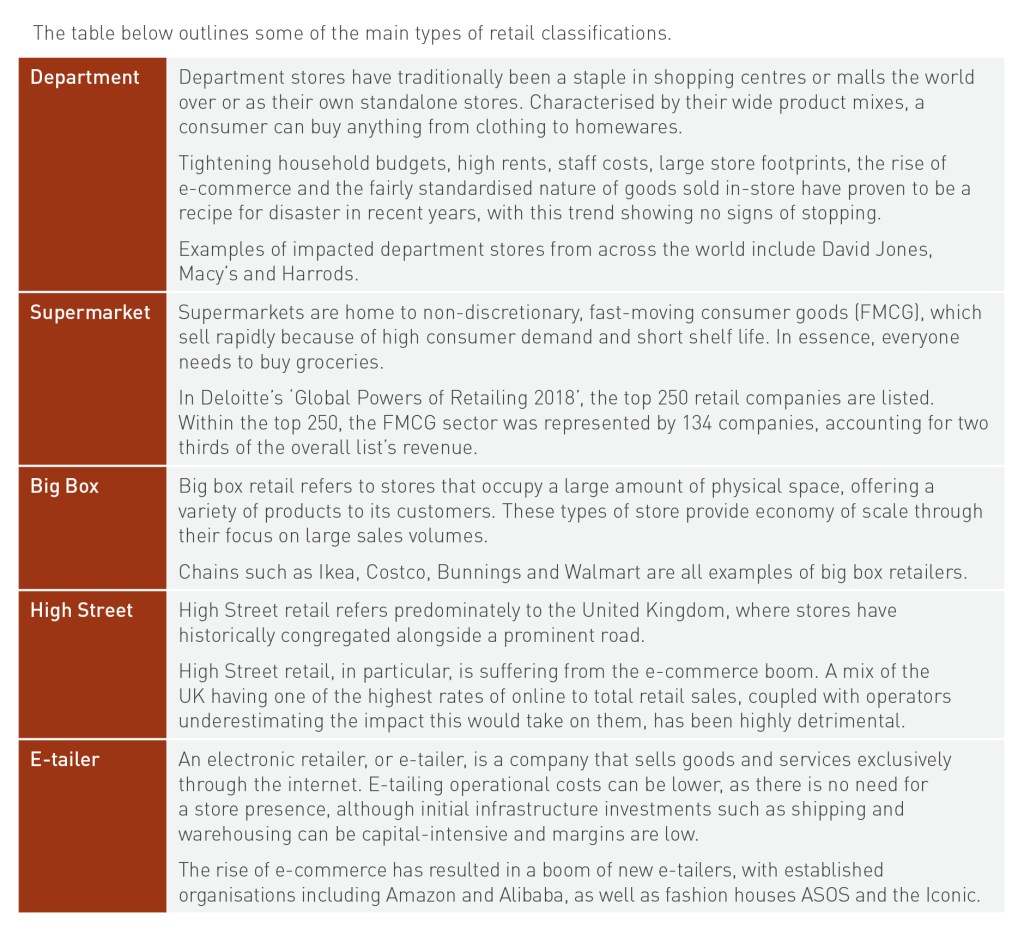
Australia has traditionally been a mix of shopping centres, big box retail (think Ikea) and everything in between, while just about every European country has a different story to tell.

What is consistent, however, is that the retail landscape at present, wherever you may be, is very much a case of adapt or perish. A primary driver of this outlook is the rise of e-commerce, which has disrupted many traditional retailers. As such, the industry has reached a point of no return, where longstanding beliefs are no longer a ticket to success.

Adaptation to quickly changing consumer behaviours is not necessarily easy for retailers, but is paramount in order to attract and retain customers. For those who can adapt, there has arguably never been a better time to be a retailer, or investor – if you know where to look.

Despite sensationalist headlines about the ‘retail apocalypse’, consumers still go shopping. While run-of-the-mill discretionary goods spend is highly vulnerable to e-commerce and tightening household budgets, non-discretionary goods and experiential factors are still prominent. As such, brick and mortar stores, are still unmatched when it comes to creating a shopping experience.

The impact of e-commerce

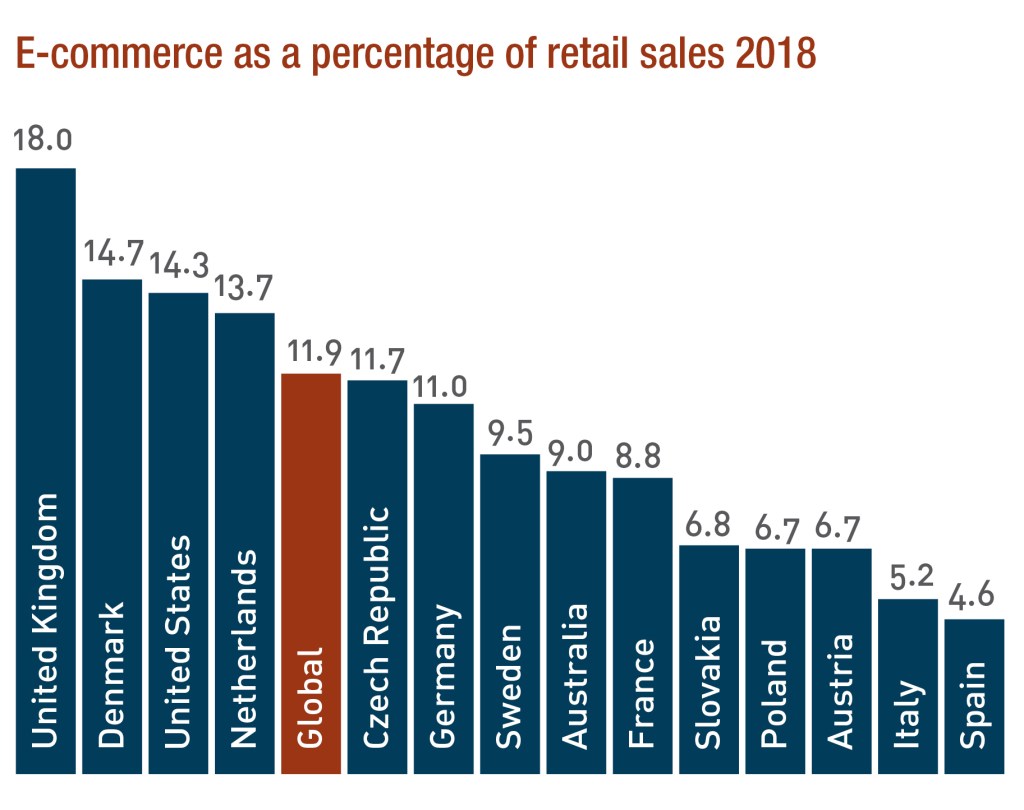
As online sales reach 11.9% of total retail sales globally, up from 7.4% in 2015 and forecast to reach 17.5% by 2021, there seems to be no sign of a reprieve for traditional operators who have not embraced the internet.
In terms of uptake for e-commerce purchase patterns, Australia lags behind about half of Europe, as well as the US, at 9% of total sales. The UK leads the pack at 18% of total retail sales, with the US sitting at just over 14%.

Between 2018 and 2023, e-commerce growth will be headlined by the United States, increasing 45.7% to US$735.4 billion per annum. France, 45.6% growth to US$71.9 billion p.a., Australia, 44.6% to US$26.9 billion p.a., and Germany, 35.6% to US$95.3 billion p.a., follow closely. The UK is anticipated to grow by less, 31.3%, to US$113.6 billion a year, but this is from a high base.

Online behemoths such as Amazon, who accounted for 40% of the United States’ online retail in 2018, continue to change the way in which consumers buy goods. The widely-held position is that this is to the detriment of traditional stores. This is evident through the demise, or seemingly impending demise of a number of big-name chains, such as Barneys New York recently filing for bankruptcy, David Jones’ owners writing down the department store’s value by $437 million, and two UK high street stalwarts, Boots and Mark & Spencer, announcing plans to close more than 300 stores between them.


The waning wealth effect

Coupled with e-commerce and cost of living pressures, the waning wealth effect also continues to impact retail investment decisions. These forces are altering consumer shopping behaviours, what they spend money on, and ultimately the performance of different retail subtypes.

Tightening of household budgets means consumers are ringfencing their non-discretionary spend while reducing their discretionary spend to the detriment of department and big box stores, as well as High Street retail.


Rental costs

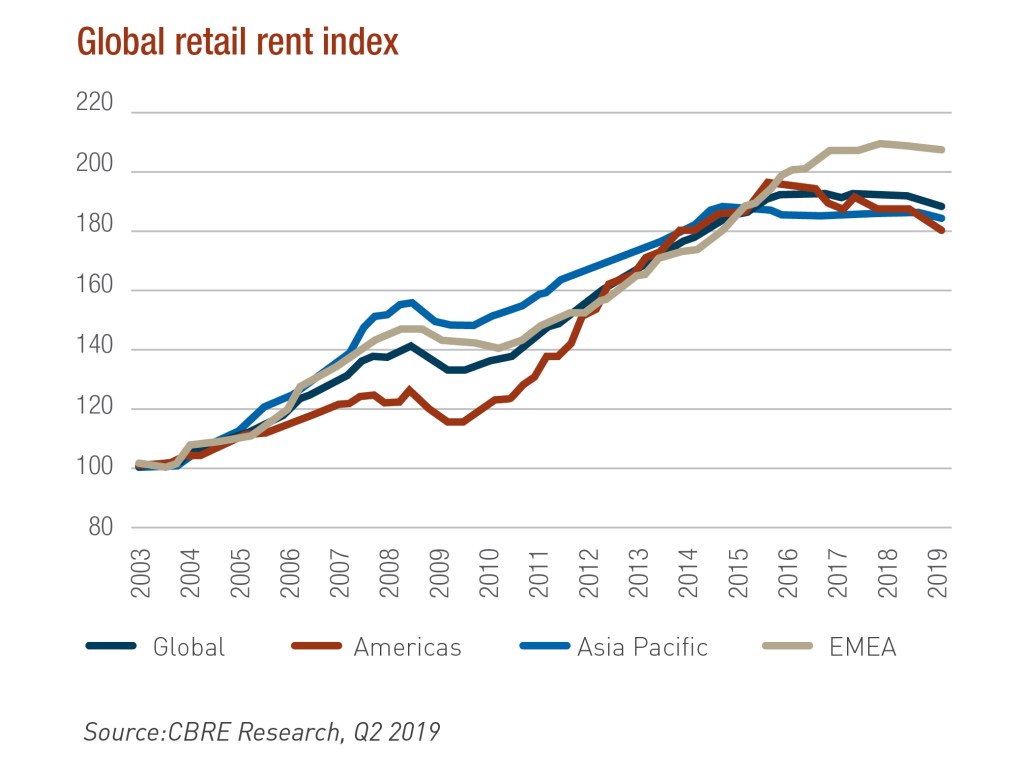
Retail rents have also begun to plateau, with downward readjustments occurring in an attempt to save struggling brick and mortar stores. However, legacy players are encumbered by high rents (often fixed and escalating), high debt levels that need to be addressed and changing consumer tastes from a discerning and cost-conscious consumer.

Even though rental growth has begun to stall, this is off the back of decades-long growth. For example, the most expensive retail location on earth in 1998, East 57th Street in New York, cost approximately US$425 per square foot (US$4,575 per sqm). Fast forward to 2018, and Causeway Bay in Hong Kong took top honours for the sixth time, with a top rent of US$2,671 per square foot (US$28,750 per sqm) – a six-fold increase.

City Council researchers in New York reported that average Manhattan rents rose 44% to US$156 per square foot (US$1,679 per sqm) between 2006 and 2016. Across the East River, Brooklyn retail rents averaged at least US$100 per square foot (US$1,076 per sqm) in 15 neighbourhoods as of 2017, up from three a decade prior.

The UK High Street is in a similar predicament with landlords consistently increasing rents. Retailers were on the expansion trail in the noughties, blissfully unaware the impact of e-commerce would have just over a decade later.

Capital: Influx or in flux?

Global

Institutional investors appear disinterested in retail assets halfway through 2019. The global retail outlook remains very much the same as it did early in the year – a degree of uncertainty clouds the economic outlook. A slowdown in China has weakened growth in emerging markets and some export-focused economies like Japan and Germany. The possibility of a no-deal Brexit has also weakened sentiment, as have the prolonged trade tensions between Trump’s United States and China. Equity markets have mostly bounced back from the lows experienced towards the end of 2018, but volatility still remains.

The retail sector continues to adjust to structural shifts, as global investment volumes in H1 2019 fell 20% on H1 2018 figures. The biggest decline was felt across Europe, the Middle East and Africa (EMEA), with H1 volumes down 43% year-on-year. The US saw a 10% decrease in H1, but on the flipside, Asia Pacific (APAC) saw a 7% rise in transaction volume.

Europe

To 30 June this year, just under 400 deals each valued at €5 million or more were closed, a stark decline on the 651 deals of a similar size through H1 2016. In terms of volume, the 400 aforementioned deals totalled €12.7 billion, which is contextually low given the €36.9 billion dealt in H1 2015.

Further, firms raising capital for strategies including retail peaked at US$3.5 billion through the first half of the year, down significantly on the last couple of years.

Australia

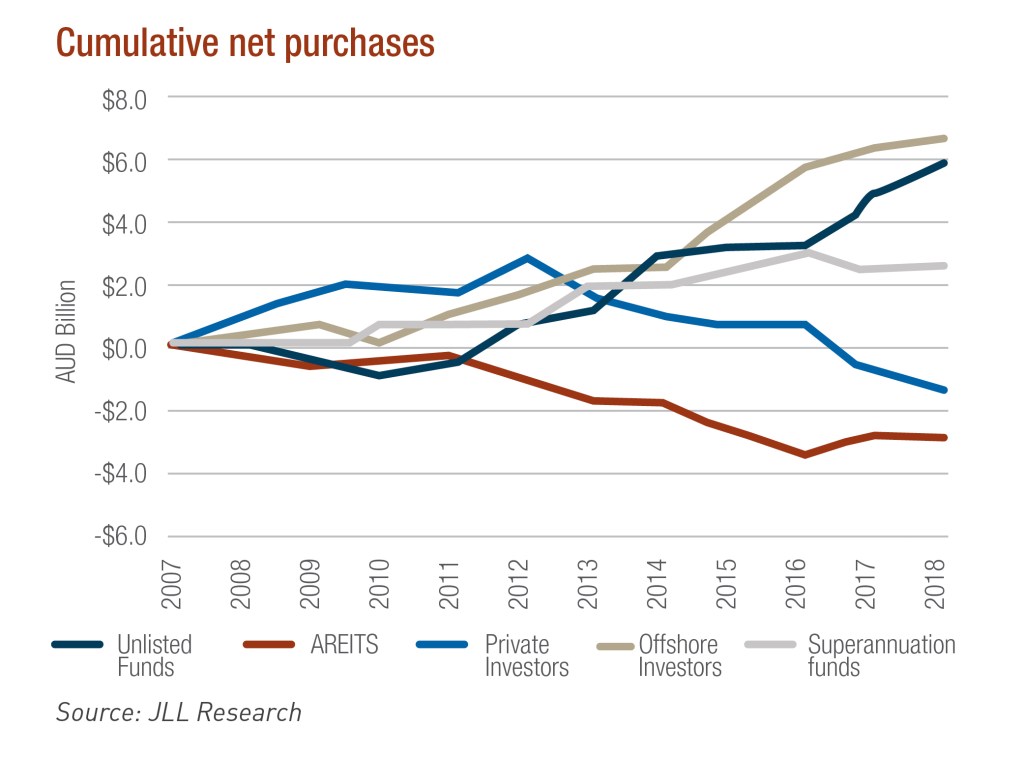
Retail transaction activity reached $8.1 billion in 2018, the third highest level on record. Unlisted funds dominated these acquisitions and it is anticipated the trend of transferring from listed to unlisted ownership will continue throughout 2019 as AREITs continue to refine their portfolios.

However, investors are proceeding with caution when it comes to retail fundamentals, particularly with regard to income stability and capital intensity.

United States

Marred by a spate of closures this year – approximately 7,500 of which were announced by major chains in the first half of 2019 alone – US retailers continue to be battered by high costs, competition from e-commerce and the debt burden carried from past leveraged buyouts.

Despite this, investors remain active. In the first quarter of 2019, US$11.1 billion in assets were traded, and despite a -4.9% year-on-year change, institutional investors are keen to deploy capital for well-located assets in primary or high-growth secondary markets.

What lies ahead?

Omni-channel retailing

Retailer success will depend significantly on a sound omni-channel strategy. Across most categories and price points, transactions are shifting online and retailers are using their store networks for customer acquisition, brand experience, online order fulfillment, returns and data gathering.

E-tailers, such as Amazon, are going one step further by adopting the ‘clicks-and-bricks’ trend, where previously online-only entities are opening physical stores – highlighting the need for an on-the-ground presence.

This makes sense, as a study conducted in Europe by Ipsos found 70% of consumers prefer to buy online with retailers who have a brick and mortar presence.

Experiential shopping

As shoppers are now able to buy almost any product, anywhere, shopping centres and malls, as well as brick and mortar retailers must therefore fulfil consumers’ desire for entertainment and experience, rather than the traditional procedure of purchasing and owning things.

Globally, leasing in malls and shopping centres will be dominated by food and beverage, cosmetics, lifestyle and experience-based offerings. Landlords of midmarket, mid-tier centres are repositioning to attract these types of tenants.

In the US, this is particularly easy given the sheer volume of vacancies caused by store closures. On the other side of the International Date Line, experiential factors remain a focus for APAC shopping centres, but a trend in co-working spaces in centre locations is also gaining prominence.

Another strategy is to seek operators that cater to the growing health and fitness-conscious consumer. This may include leasing space to a gym or fitness centre, as well as seeking health-focused food and beverage tenants, or even food and produce markets.

In APAC alone, growing consumer demand for experiential shopping is expected to see experience-based spending total US$825 billion between 2018 and 2030. Centres with established experiential retail models are proof of how successful they can be.

There is no shortage of opportunity for those who know where to look. Moving forward, in an almost oxymoronic way, retail will likely form a smaller part of the tenant mix, as non-retail facilities such as restaurants, childcare facilities, fitness and services become standard in many locations.

Traditional retail is therefore being resized, reinvented and reimagined. This is leading to retailer restructuring and shrinking store networks and the disruption is creating the inevitable opportunities for new operators and formats to emerge.

A person typing on a laptop

Research and Insights

Home Research Page 5
June 24, 2019

Retirement living state of play and outlook

Jack Green


Australia’s birth rate between 1946 and 1964 increased substantially, fuelling a significant structural shift in Australia’s demographic make-up. Labelled ‘baby boomers’, and currently aged between 55 and 73 years of age, this generation is today shaping the way retirement accommodation is provided to older Australians.

Living longer

Medical, economic and societal advances are allowing people to drastically outlive even relatively recent life expectancy estimates. If you are currently 65 years of age, your life expectancy when you were born was around 68 for males and 74 for females.

However, before you panic, there’s good news. Resulting from the aforementioned advances, as a 65-year-old, you are now, on average, expected to live another 19.5 years if you are a male, and 22.3 years if you are a female1.

As of 2017, there were 3.8 million Australians aged 65 or above, which comprised 15% of the total population. For reference, this figure was just 1.3 million (9%) in 1977 and is anticipated to be 8.8 million (22%) by 20572. This growth is expected to drive a large increase in retirement and aged care demand, and highlights the opportunity to both existing operators and new market entrants.


Retirement living and aged care: What’s the difference?

Retirement living

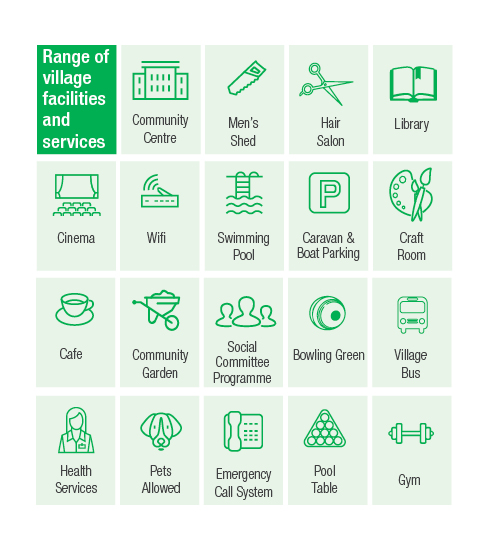
Defined as a residential dwelling and lifestyle complex, generally for independent and self-funded retirees over the age of 55, retirement living villages are made up of private homes, called Independent Living Units or ILU’s, and usually offer a range of shared facilities, such as community centres, pools, gyms and sports facilities.

According to the most recently available data, there were just over 170,000 ILUs in 2016, housing over 220,000 people. As baby boomers start to retire, it is anticipated that by 2036, the market will have approximately doubled in size1.

However, there is an increasing disparity between actual supply and this demand. The November 2018 PwC/Property Council Retirement Census, which saw contributions from 52 retirement living operators representing over 610 villages showed only 2,000 new ILUs are set to hit the market each year across the next four years. This current rate of supply is, on average, less than one quarter of what is required.


Aged care

Unlike the retirement living sector, where additional healthcare and support is not the primary service driver, the aged care sector provides fulltime care to individuals requiring supervision and assistance.

As per the most recent statistics at June 2016, there were just under 200,000 residential aged care beds operational in Australia. Between 2009 and 2016, only 21,000 new places became operational, even though population growth amongst the 70-plus age cohort was 23%3.

It is estimated that by 2026, an additional 87,000 places will be required nationally in order to meet demand. This challenge will be heightened by any recommendations that may arise from the Aged Care Royal Commission.

Periodic reviews of the aged care industry have centred on whether the community can have confidence in the quality of the care being provided, and the effectiveness of the regulatory framework.

All previous reviews unanimously concluded that the aged care system is in need of reform, and it’s anticipated the current Royal Commission will do the same. The system is complex and fragmented, and history demonstrates reform has been exceedingly difficult to implement.

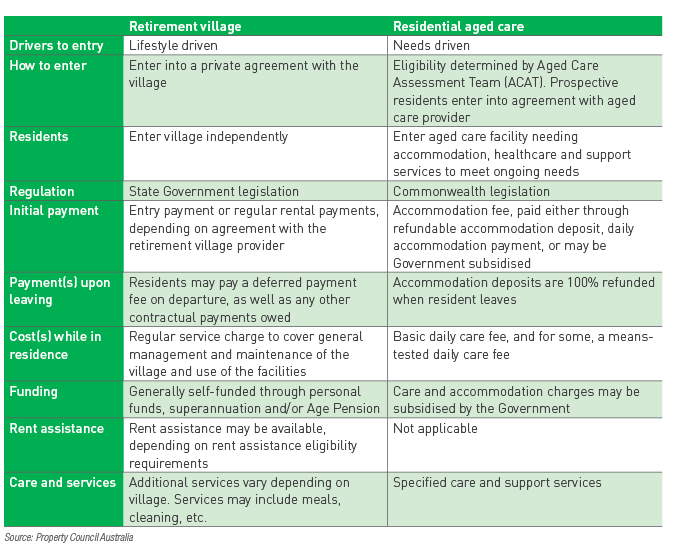
The table below highlights a number of key differences between retirement villages and residential aged care in Australia.


A person typing on a laptop

Research and Insights

Home Research Page 5
April 5, 2018

Poland to continue to prosper

Almost three decades removed from communist rule, Poland has emerged as the growth engine of the Central European economy. From its inclusion in the EU, to its strong future growth forecast, there are numerous reasons that highlight Poland as a potential investment destination.


History

Poland’s long, often dark history has been wrought with hardship. The formal beginning of World War II was marked through the invasion of Poland on 1 September, 1939. By the end of the war, Poland had lost over 6 million people, more than 20% of its prewar population.

44 years of communism followed, prior to its collapse in 1989 after Poland’s first partially free and democratic elections since the end of the war. The early 1990s saw significant reforms that allowed the country to transition from its socialist-style planned economy into a market economy.

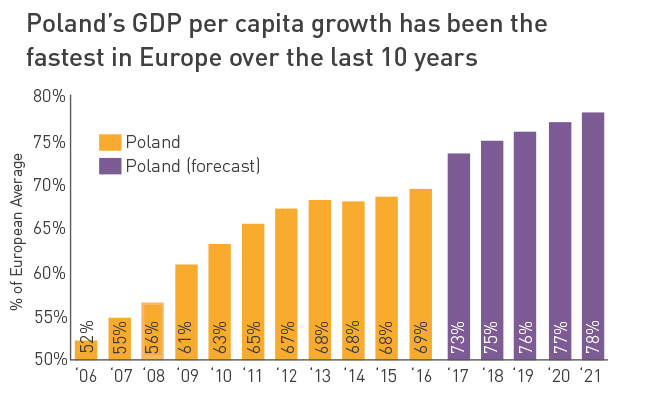
The two-and-a-half decades since has seen Gross Domestic Product (GDP) rise from USD$1,731 per capita in 1990 to USD$12,399 per capita in 2016. This was the fastest growth amongst all OECD nations. GDP per capita is still only just over a third (34.8%) of the European Union (EU) average, leaving strong upside for future growth to occur.

Poland-GDP-vs-EU


Poland-GDP-over-10-years

Poland and the European Union

Poland joined the EU in 2004, along with nine other nations. Between 2007 and 2013, Poland received approximately €67 billion, making it the largest beneficiary of the European Cohesion Policy through this period. For the period of 2014 to 2020, this allocation has been increased to €86 billion.

However, Poland’s time in the EU hasn’t all been smooth sailing. Late last year, the European Commission triggered an unprecedented sanctions procedure against Poland, contending that the Polish government had effectively seized control of the judicial system.

While there are serious concerns about the threat to the independence of the judiciary, market commentators have considered it unlikely that this divide will escalate, with Hungary in particular vowing to vote down any further European Commission action.


Mastering their own destiny

Through the two years of Poland’s dispute with the EU, there have been no adverse effects to the economy. A surge in Polish domestic investment last quarter was a sign that the economy was unaffected, even as tensions heightened.

While it is unclear whether Poland will remain the largest net recipient of funds in the EU bloc’s post- 2020 budget, the Polish government is increasingly focusing on facilitating growth and development on its own terms.

One such example is the decision to not renew a contract that sources nearly two-thirds of Poland’s gas from Russia, thereby ending a reliance that has spanned 74 years. From 2022 onwards, Poland’s gas will be sourced from liquefied natural gas (37% – up on 2017’s 11%), its own production (20%), and a newly formed reliance on Norway (43%).

The past positioning the future

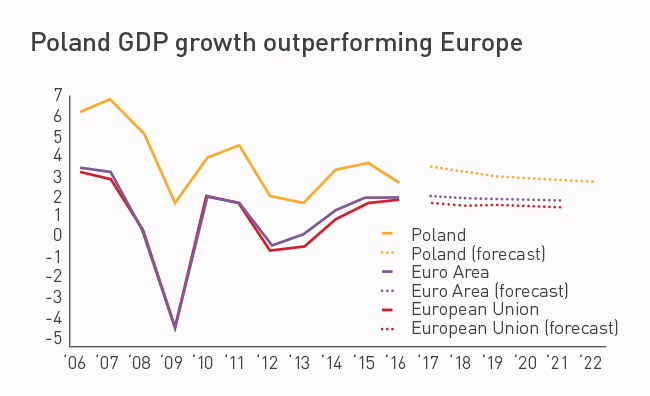
The ongoing resilience of the Polish economy has positioned it well for continued expansion. Throughout the 2008 Global Financial Crisis (GFC), Poland was the only EU member that did not fall into a recession. In 2009, while the GDP of the EU declined by 4.5%, Poland’s grew by 1.6%.

At the onset of the GFC, Poland’s public debt was below 50% of GDP, low in comparison to other European countries. This, in part, was the result of a clause written into the country’s 1997 constitution limiting government borrowing to 60% of GDP.

Coupled with a large and growing domestic economy, increasing domestic consumption, a business-friendly political class, very low private debt and a flexible currency, sound economic management saw Poland avoid recession.


A strong economic horizon

A decade on from the GFC, the Polish economy is forecast to remain one of the fastest growing European economies throughout 2018. Growth is set to remain strong at 3.8%, down slightly on 4.4% in 2017. The key growth driver for the economy now is private consumption.

In Q4 2017, growth surged to its strongest level in six years, powered by a mix of consumer demand and an investment rebound. This is expected to continue in 2018 with investment growth set to reach 4.5%.

The labour market continues to tighten, with the unemployment rate sitting at 6.7% as of November 2017. This is largely the result of profound changes in the labour market. Poland’s population is ageing, meaning fewer workers in the labour force. Additionally, technological and structural change in the economy is changing the demand for workers. Both of these ‘push and pull’ factors have resulted in a decreasing unemployment rate.

A comprehensive series of education reforms Poland has pursued since the early 1990’s has also given rise to a highly-skilled and largely educated workforce. These reforms have been so successful that they are, in part, responsible for the rising employment and wage pressures that mean real income is growing faster than inflation.


Poland as an investment destination

Market demand, market cost, exchange rate, sovereign credit and trade credit risk ratings for Poland are all significantly lower than the respective emerging market averages. Additionally, Poland’s score of 62.0 on the Corruption Perception Index is far better than the emerging economies average of 38.0.

In 2017, Poland’s zloty surged 5.4% against the Euro, the second-best performance amongst emerging market peers.

Foreign investors see Poland as an attractive investment destination due to its economic stability, educated workforce, potential consumer base, as well as its strategic geographic position being surrounded by Germany, Slovakia and the Czech Republic.

As Poland continues on the growth path that was kick-started just over two decades ago, GDP and living standards have further to rise. Even as growth tightens slightly through 2018, the likelihood is that it will continue to be well above the EU average for the immediate future.


Polish economy at a glance
  • The past 25 years has seen the Polish economy double in size, with GDP per capita growing from 32% to 60% of the Western European GDP per capita.
  • GDP growth was 4.4% in 2017 and is forecast to be 3.8% in 2018, prior to moderating to 3% until 2021.
  • Sixth largest EU economy and only country in the region to avoid a recession during the GFC.
  • Unemployment was 6.7% in late 2017, reaching decade lows due to strong job growth.
  • Strong private consumption has been a key driver of growth, having reached nearly 5% in 2017.
  • Total investment volume in Poland in the commercial property sector reached over €4.7 billion in 2017, with the retail market representing a 40% share.
  • Between 2001 and 2014, average retail expenditure was growing at 6.1%, compared to 0.8% in Germany and 3.3% in the UK.
  • Highly educated workforce, which will benefit from the global trend to higher skilled work and therefore have a higher disposable income.
A person typing on a laptop

Research and Insights

Home Research Page 5
December 20, 2017

Is Brisbane back?

With Sydney and Melbourne commercial office property very much in demand, investors have been looking at Brisbane as a viable alternative investment option. In this article, we consider the opportunities and challenges of investing in commercial property in Brisbane.

Prices are at historic highs in Sydney and Melbourne, in part due to a strong influx of overseas capital. Yields on recent landmark CBD prime office transactions have been as low as 4.5%. As a result, some investors are looking at Brisbane due to it having a higher comparative yield. As ever, there are wider issues to consider rather than just a simple price based comparison.


Brisbane’s current position

While Brisbane is less than half (45%) of the size of the Sydney office market, it currently has much higher vacancy rates of 15.7% and incentives up to 40%. Sydney and Melbourne are hovering around 6.0% and 6.5% vacancy with incentives of 22% and 30% respectively.

Brisbane’s high vacancy rate can be primarily attributed to the end of the mining boom, and reduction in demand from mining and related services industries. This has resulted in weak tenant demand and an excess of office space.

Additionally, construction of new office space in the Brisbane CBD, particularly the completion of 1 William Street in October 2016, and the accompanying move by government employees into their dedicated 74,800 square metre (sqm) building, has created additional vacancy.

This has led to what can be described as a tenant’s market, with landlords having to compete heavily. Refurbished floor space, upgraded building services, and offering speculative fitouts are all options they have come to rely on. The latter has become increasingly popular amongst sub-1000 sqm tenants – who made up a majority of demand in 2017.

Is-Brisbane-back

Brisbane of the future

Ambitious tourism projects and upgrades due for completion in the next few years will all contribute to Brisbane’s future.

This will include the proposed Port of Brisbane cruise terminal which is due to open in 2020. The terminal will deliver a permanent docking space for the world’s largest cruise ships, which are currently unable to pass under the Gateway Bridge, and transform the city into a major cruise destination.

A widespread focus on upgrading Brisbane’s masterplanned trade and industry site, TradeCoast, will also boost business prospects. The parallel runway project at Brisbane Airport, the biggest aviation project in Australia, will see a 60% increase in annual flights upon completion in 2020. This is expected to deliver economic benefits of $5 billion per year by 2035.

Initiatives such as these are significantly increasing the region’s trade prospects by transforming Brisbane into a better connected global hub.

There are also a number of Brisbane city based infrastructure projects underway including Howard Smith Wharves and the $3 billion Queens Wharf project. Additional projects currently undergoing the approval process include the $2 billion Brisbane Live project and the $944 million Brisbane Metro transport system. These will all deliver thousands of jobs during construction and further opportunities for businesses once complete.

The office outlook

The Brisbane office market is currently near the bottom of the cycle (see Insight, Spring 2017). Despite the tourism and trade projects that are currently underway or in the wings, conditions are expected to remain tough over the coming two to three years.

The continued lacklustre demand from mining and other services industries has kept employment growth relatively weak. This means there is little prospect of a substantial improvement in demand to absorb the existing overhang of office space.

The saying goes, ‘build it and they will come’, but it takes time for substantial infrastructure, trade and tourism improvements to come to fruition.

Slow economic growth may mean only minor improvements in the commercial office market in the short term. Stronger growth over the longer term, alongside extensive infrastructure projects, should begin to push the vacancy rate trend downwards, with momentum gaining as time progresses. While Brisbane may not be ‘back’ just yet, all signs point to a promising future.