What about a ‘per capita recession’?
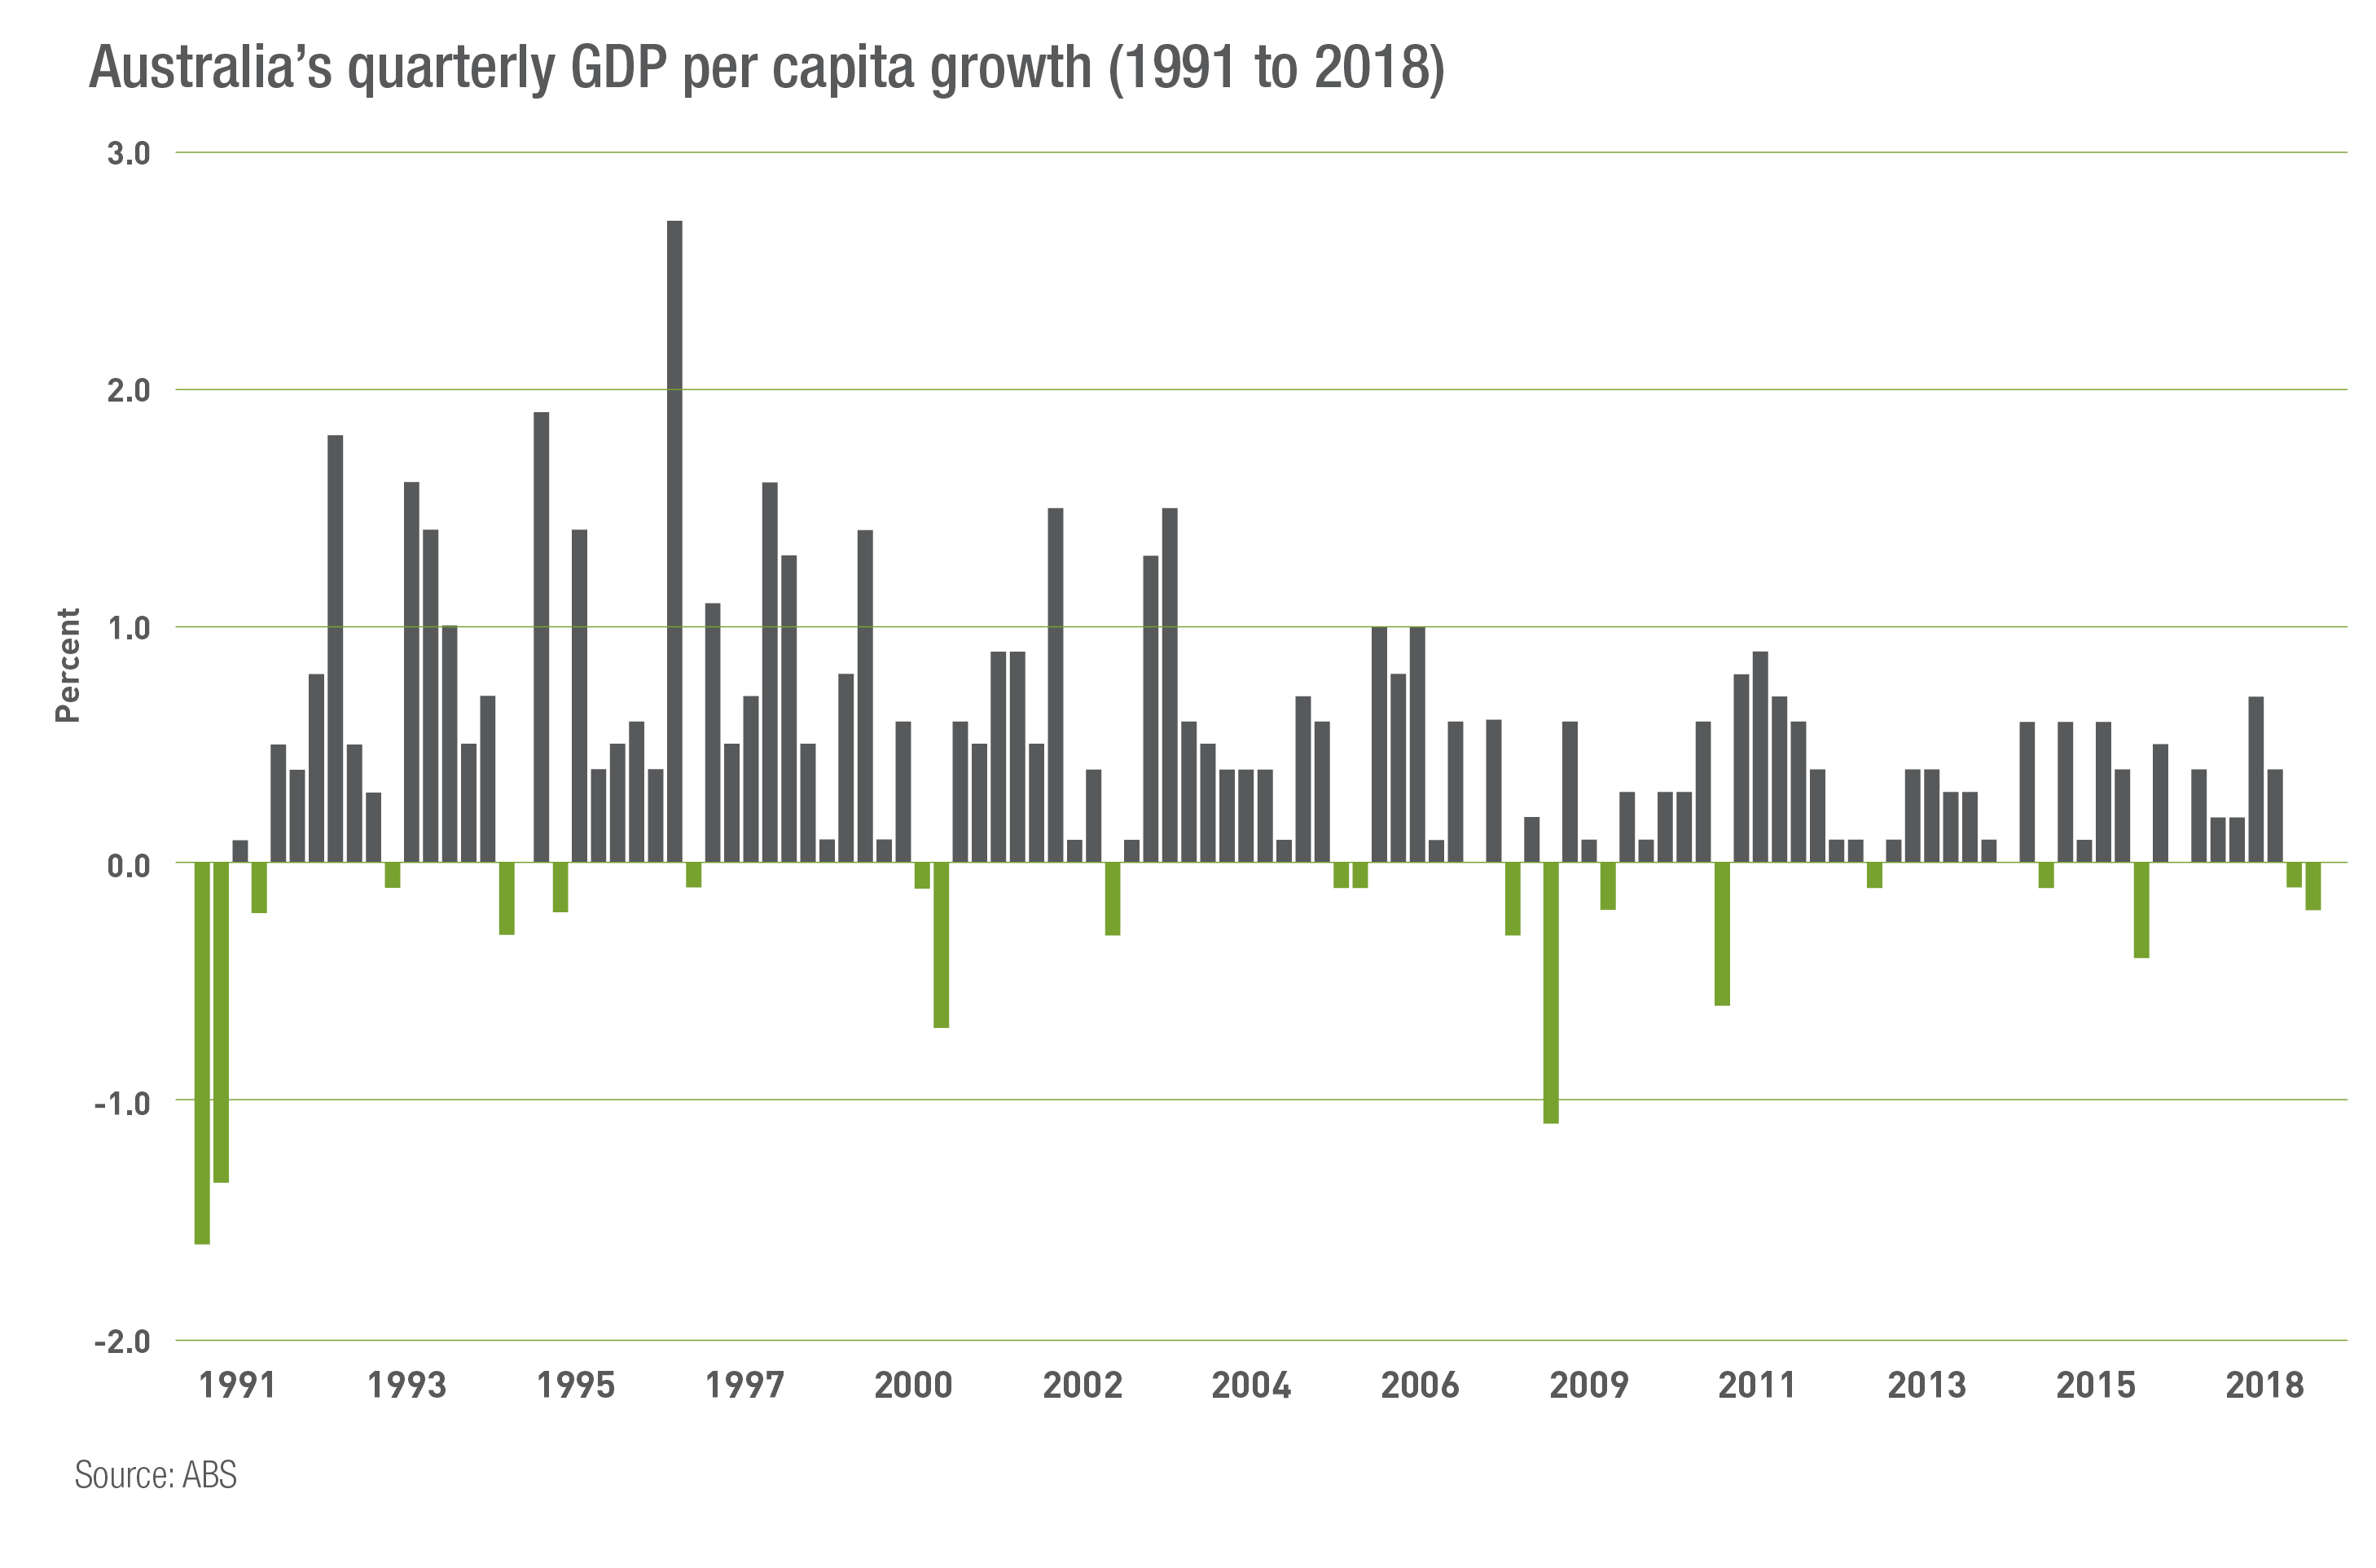
The claim that Australia has gone almost three decades without a recession has been under fire in recent years, particularly as Australia suffered a ‘per capita recession’ to close out 2018. The September (-0.1%) and December (-0.2%) quarters saw negative GDP per capita growth.
The second half of 2018 marked the third time this had happened since Australia’s conventional recession in 1991. The September (-0.1%) and December (-0.7%) 2000 and March (-0.1%) and June (-0.2%) 2006 quarters each saw negative growth in GDP per capita.
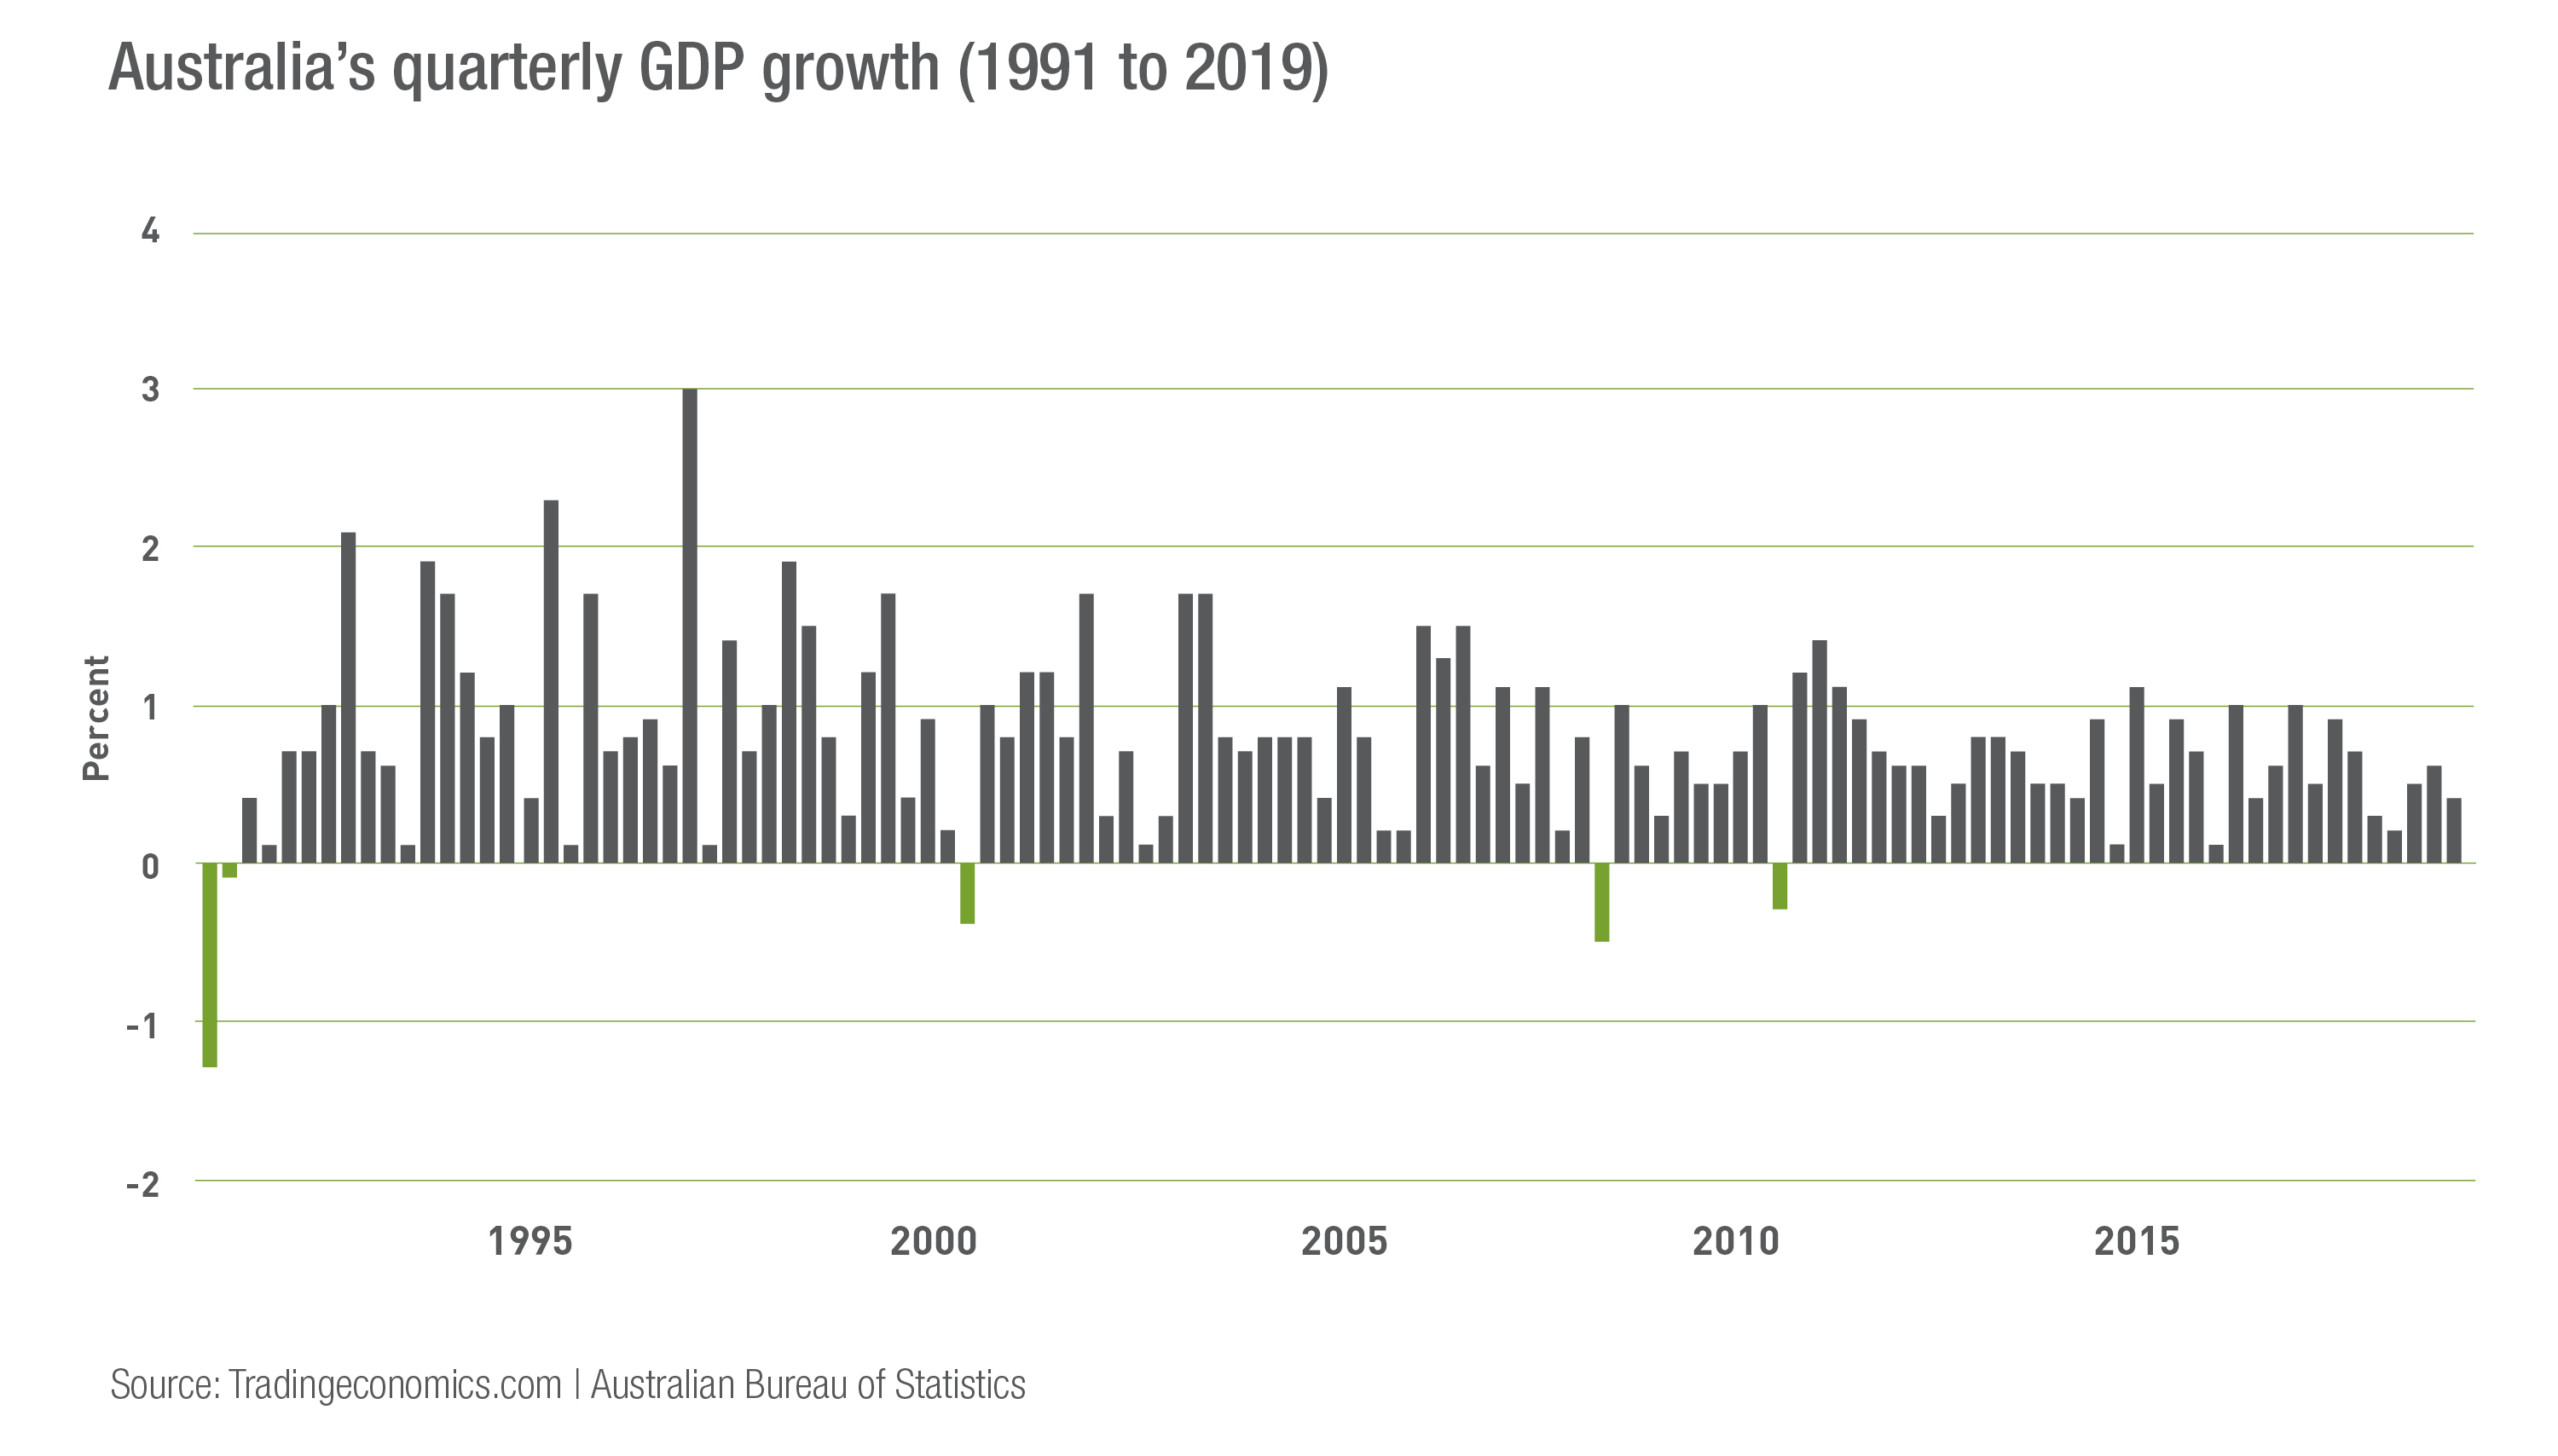
Additionally, while there have only been three negative GDP growth quarters since 1991, there have been 20 quarters of falling GDP per capita growth.
However, it may be unfair to call consecutive quarters of negative per capita growth a recession at all, as it more closely resembles a slowdown. For example, through the 2006 ‘recession’, job growth remained solid, unemployment fell, and it occurred while Australia was in the midst of its mining boom.
Growth slowing below the level of population growth, especially with weak wages growth and high underemployment, is a concern as it effectively highlights that people are less well off than they were before. A per capita recession on its own, however, is not necessarily the same as a real recession, and the three seen over the past 28 years do not compare to the impact of the 1991 recession on jobs, confidence and economic welfare.
Examples on the global stage
In 2018, 17 countries, the majority of which are emerging economies, recorded positive annual GDP growth, but negative growth in GDP per capita. Of these countries, Bahrain experienced perhaps the greatest disparity between annual growth in GDP (1.78%) and GDP per capita (-3.11%), with population growth at 4.92%.
Compare the emerging economy of Bahrain, to one of the world’s most highly-developed economies’ in Japan. In 2018, Japan’s annual GDP growth was 0.78%, a full 1% behind Bahrain. However, with an ageing population and shrinking workforce Japan’s population declined 0.2%, meaning GDP per capita was actually higher at 0.99%.
While the economic profiles of Japan and Bahrain are vastly different, the above demonstrates an increase in GDP per capita, as in Japan, does not always make it a better indicator, particularly when a country’s population is in decline.
As more major economies begin to reach peak population, as currently experienced by Japan, Russia and some of Western Europe, their GDP growth will, in turn, begin to decline unless they find ways to become substantially more productive, and do ‘more with less’.
Australia’s population is expected to grow 24% to 31.4 million by 2034, meaning over the medium term our GDP figures should continue to be propped up by this increase. However, if productivity and population growth were to decline at the same time, we might need to reconsider how we measure economic success, particularly if gross GDP numbers become consistently negative year in, year out.
Population growth and productivity
It takes, on average, 2.1 children born per woman to maintain a country’s population – this is known as the replacement rate. The current global fertility rate sits at 2.44 children per woman. However, since the 1960’s, the rate has halved and is below the replacement rate in most western countries.
Presently, just under half of the world’s population live in countries with a fertility rate below the replacement rate. Because these countries are not repopulating fast enough to maintain their current population, an imbalance is emerging between the ratio of elderly dependents to working-age people. This is set to intensify over coming decades.
The United Nations predicts that by 2100, almost 30% of the population will be aged 60 or older. As life expectancy continues to increase steadily, dependents will live longer. This will have a range of economic impacts.
Healthcare costs will strain resources, while smaller working populations will struggle to produce enough income tax revenue to support these rising costs. If left unchanged, this will likely cause spending power to decrease, consumerism to decline, job production to slow, and ultimately, the global economy to stagnate.
Immigration has been a solution for many countries, particularly Australia and the United States. In 2017, Australia’s net migration figure was 263,300, which represented 1.07% of the population, while the US figure was 4,774,029, representing 1.47%.
Several nations are already experiencing the effects of an ageing population with existing elderly dependents. A quarter of Japan’s population is currently over the age of 65. With a far lower net migration rate (357,800 in 2017, representing just 0.28% of the total population), Japan is attempting to utilise R&D and technology to substantially increase productivity and offset the demographic driven slowdown of its GDP.