Understanding commercial property Archives - Cromwell Property Group
A person typing on a laptop

Learn

Home Understanding commercial property
May 22, 2026

From Growth to Income: How the Federal Budget is reshaping investment priorities

This article contains general information and commentary only. It does not constitute investment advice or a recommendation. This document reflects the views of its author as at May 2026. These observations are based on current policy proposals and market conditions, which may change. 

For investors assessing portfolio allocation, the key takeaway from this Federal Budget is the broader policy shift rather than any single measure. To the extent proposed tax changes reduce the relative appeal of residential strategies that depend more heavily on tax advantages and capital growth, income-producing assets may warrant closer consideration. That may improve the relative appeal of quality commercial real estate, where returns are often supported by contracted cashflows, tenant covenants and leasing fundamentals, although the extent of that benefit will depend on how different components of return are ultimately taxed.

Portfolio strategies already shifting given macro backdrop

This reset is landing at a time when investors are already recalibrating around two dominant macro themes: 

Against that backdrop, proposed Budget measures introduce additional considerations for investors, and potentially tilt preferences toward assets that are more income-oriented. 

What changed (and why it matters for property investors) 

Two measures were particularly salient for investors: 

 

1) Negative gearing changes (residential focus) 

Proposed reforms to negative gearing for established residential property may reduce the relative after-tax appeal of some residential strategies, particularly those that rely more heavily on tax settings to support returns. For investors, the key implication is comparative: if established residential after-tax outcomes become less attractive, some investors may place greater weight on other asset classes. In that context, commercial property may warrant closer consideration, particularly where return profiles are supported by income and leasing fundamentals rather than reliance on tax settings to enhance outcomes. 

2) Capital gains tax (CGT)  

Proposed changes to CGT may diminish the after-tax payoff from capital gains for some investors, which may increase the relative appeal of strategies supported by current income rather than purely back-ended appreciation. 

However, the implications for commercial property investors are more nuanced. While proposed changes to negative gearing are focused on residential property and do not directly affect the deductibility of income from commercial assets, commercial investors may be exposed to the changes in CGT. In addition, many private investors hold commercial property through discretionary trusts, where forthcoming tax changes may further influence after-tax outcomes. 

For property trusts in particular, part of the income distributed can be tax deferred, which reduces the cost base over time and can shift a portion of returns into capital gains. This means overall outcomes may still depend meaningfully on CGT treatment at disposal. 

As a result, while income-oriented strategies may become relatively more attractive, any reduction in the CGT discount could still weigh on total returns for some commercial property investors, depending on structure and the balance between income and capital growth.  

The impact won’t be uniform: two investors can hold the same asset and experience different net outcomes. Investors may wish to assess exposure at the structure level (individual, company, trust, SMSF, etc.) and seek advice where appropriate. 

Why commercial property looks relatively stronger  

Commercial real estate’s return profile is typically anchored by rental income (often with CPI or fixed escalations) – supported by: 

  • Lease terms and WALE (weighted average lease expiry) 
  • Tenant covenant quality and occupancy fundamentals 
  • Asset selection and active management (leasing, retention, capex discipline) 

In other words, while capital growth matters, many commercial property strategies are not primarily dependent on it.  

In that context, wellselected commercial property may play a stronger role as a portfolio income stabiliser and diversifier, particularly where cashflows are supported by leasing fundamentals and supply constraints, noting that after-tax outcomes will still vary depending on investment structure and the treatment of capital gains over time, making it important for investors to consider how their investment structure influences aftertax outcomes. These characteristics do not remove risks associated with commercial property, including tenant concentration, leasing risk, valuation movements and changes in financing conditions. 


Bottom line

The Budget doesn’t rewrite the investment case for commercial property, but it may be considered by market participants to improve its position within portfolios relative to strategies for established residential that are more reliant on tax settings and capital growth. Combined with macro conditions that elevate the value of dependable cashflows, the policy direction reinforces a simple point for investors: 

In a world where growth is less advantaged and uncertainty remains elevated, contracted income and real‑asset diversification matter more. 


Disclaimer

This material is prepared for discussion only and should not be relied upon for any other purposes. It has been prepared on a good faith basis but its contents have not been formally verified, and no Cromwell entity or person accepts any duty of care to any person in relation to the information it contains. It should not be considered to be investment advice, marketing material or a promotion or offer of any Cromwell fund, product or services. Any person that wishes to invest in any Cromwell fund, product or service should refer to the relevant information or legal documents produced in relation to such opportunity before making any investment or other decisions.  

A person typing on a laptop

Learn

Home Understanding commercial property
April 28, 2026

Higher Interest Rates and the Implications for Unlisted Property

Recent geopolitical developments, particularly disruption to the Strait of Hormuz, have driven a sharp repricing of interest rate expectations. Financial markets now anticipate an additional 64bps of cash rate hikes this year1, while the Australian 10-year Government Bond Yield has increased by 34bps since late February2. For commercial property investors, the key question is how these changes translate into asset values, income, and risk.

The relationship between interest rates and cap rates is often simplified – higher interest rates lead to higher cap rates, and therefore lower values. While directionally correct, this framing overlooks a critical point: property markets are not driven by interest rates alone, but by how those rates reshape the broader cost and availability of capital, and supply and demand levers. It is within these interactions that both risks and opportunities emerge.

Key takeaways

  • Rates matter, but capital conditions matter more: what investors demand (and how much capital is available) ultimately drives pricing, rather than a fixed spread to bond yields.
  • Outcomes aren’t uniform: the impact of higher interest rates varies across assets, capital structures, and investment strategies.
  • Dislocation creates opportunity: where tenant demand remains resilient and supply constraints limit new competition, attractive entry points can emerge.

Required return: the anchor for property pricing

At a fundamental level, property yields are anchored to the risk-free rate, typically represented by long-term government bond yields. Investors require a premium above this base rate to compensate for the additional risks inherent in property, such as illiquidity, leasing risk, and asset-specific factors.

In simplified terms, cap rates can be understood as the sum of the risk-free rate and a risk premium. When bond yields rise, the required (or target) return also increases, placing upward pressure on cap rates and downward pressure on values. This relationship isn’t unique to property – all asset classes are priced relative to the risk-free rate and face similar value adjustments.

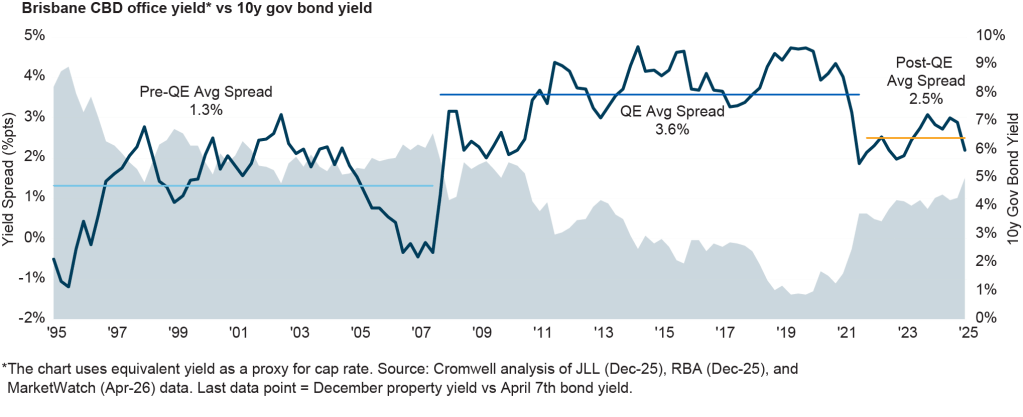
However, this relationship is not mechanical, and the risk premium embedded in cap rates is not fixed. It expands and contracts depending on market conditions, rent growth expectations, investor sentiment, and capital flows, and may move sharply or gradually, immediately or with a lag. The chart below highlights this variability in the spread between bond yields and property cap rates over time, using Prime Brisbane CBD Office as an example.


Importantly, it shows that the current spread is consistent with the long-term historical range, despite the recent increase in bond yields. The decade leading into the pandemic exhibited a wider yield spread, however this period was defined by below-trend economic growth and unprecedented monetary intervention.

Quantitative easing suppressed government bond yields3 to anomalously low levels, and pricing relationships observed during this period are unlikely to represent a sustainable long-term baseline. The chart also shows that periods of negative spread can occur when robust rent growth is expected.

Cost of debt: asset and vehicle-level impacts

While required returns determine what assets should be worth, the cost of debt plays an important role in both the ongoing performance of leveraged assets and the prices buyers are able to pay.

For existing investments, higher interest rates – to the extent they are unhedged – increase borrowing costs, reducing net income and, in some cases, distributable earnings. The degree of impact varies materially depending on capital structure, hedging, and refinancing profiles, with assets exposed to near-term repricing more directly affected.

For new transactions, higher borrowing costs reduce the level of leverage that can be supported by a given income stream. Additionally, as the spread between asset yield and the cost of debt compresses, the benefit of leverage diminishes and equity returns decline.
In practical terms, higher funding costs reduce many buyers’ maximum bids, unless they are willing to accept lower returns. This effect is often reinforced by more conservative lending conditions. As interest rates rise, interest coverage ratios compress, and lenders may respond by reducing leverage, tightening covenants, and adopting a more selective approach to capital deployment. This further constrains the availability of capital, amplifying the impact of higher borrowing costs on both transaction activity and pricing.

However, the impact is not uniform. Investors with greater certainty over funding costs, or those less exposed to near-term repricing risk, may be better positioned to transact in this environment.

Liquidity: how markets actually reprice
Changes in required returns and borrowing costs are not reflected in property values immediately or uniformly. Instead, they emerge through transaction activity, which typically slows as financial conditions tighten.

As borrowing costs rise and lending conditions tighten, fewer buyers are able or willing to transact at prior pricing levels. This reduces competitive tension and leads to lower transaction volumes.

In this environment, transactions often occur between the most motivated sellers and well-capitalised or opportunistic buyers. Observed pricing can be influenced by the specific circumstances of those participants, rather than reflecting a broad cross-section of the market.

This helps explain why property markets often adjust in stages. Valuations are typically based on a body of transaction evidence, with individual transactions assessed for relevance and representativeness. In periods of low activity, isolated trades – particularly those involving motivated or forced sellers – may not be viewed as reflective of broader market conditions. As a result, a sufficient weight of evidence is often required before pricing benchmarks are reset. Importantly, this is not a sign of market dysfunction, but a feature of how private markets absorb new information.

Income stability vs valuation volatility: a temporary divergence


One of the defining characteristics of real estate is the relative stability of its income profile. Lease structures provide contractual cash flow, and rental adjustments typically occur gradually. Valuations, by contrast, can adjust more quickly through changes in required returns. This can create a divergence, where asset values decline due to higher cap rates even as underlying income remains stable or continues to grow. For long-term investors, this distinction is critical – valuation adjustments can create opportunities to acquire quality assets with robust fundamentals at more attractive pricing. It also reinforces the need to look beyond headline yields and focus on risk-adjusted returns across the entire investment hold period.

From adjustment to opportunity

Periods of rising interest rates are often accompanied by uncertainty and volatility. However, they can also present compelling opportunities for investors.

As highlighted in our previous article, the balance of supply and demand is the biggest driver of unlisted property performance over the long-term. The supply outlook for most property sectors was already significantly constrained heading into 2026, and recent inflationary pressures and interest rate changes linked to the Middle East conflict are likely to further limit new project commencements. For well-located existing assets with resilient tenant demand, this dynamic supports the medium-term outlook.

Risk-off sentiment and attractive entry pricing also create a more constructive environment for capital deployment. For investors with a long-term perspective and a disciplined approach to asset selection, dislocations between fundamentals and sentiment may enable the acquisition of quality assets below fair value.

As markets recalibrate, the focus shifts from navigating volatility to selectively capturing value. In that transition, the foundational drivers of unlisted property performance – income, asset quality, and long-term space market fundamentals – remain central to long-term investment outcomes.

1. ASX, as at market close 2nd April 2026
2. MarketWatch, as at market close from 27th February 2026 to 7th April 2026
3. Why Are Long-term Bond Yields So Low?, RBA (May-19)

This document has been prepared by Cromwell Funds Management Limited ABN 63 114 782 777, AFSL 333214 (CFM) and Cromwell Property Securities Limited ABN 11 079 147 809, AFSL 238052 (CPSL), both of which are wholly owned subsidiaries of Cromwell Corporation Limited ABN 44 001 056 980; and Cromwell Real Estate Partners Limited ACN 152 674 792 (CREP) as trustee for the Cromwell Creek Street Investment Trust. All statistics, data and financial information are prepared as at 31 December 2025 unless otherwise indicated. All dollar figures shown are in Australian dollars unless otherwise indicated. While every effort is made to provide accurate and complete information, Cromwell does not warrant or represent that the information is free of errors or omissions or is suitable for your intended use and personal circumstances. Subject to any terms implied by law that cannot be excluded, Cromwell accepts no responsibility for any loss, damage, cost or expense (whether direct or indirect) incurred by you as a result of any error, omission or misrepresentation in the document. This document is not intended to provide investment or financial advice or to act as any sort of offer or disclosure document. It has been prepared without taking into account any investor’s objectives, financial situation or needs. Any potential investor should make their own independent enquiries, and talk to their professional advisers, before making investment decisions. Past performance is not a reliable indicator of future performance. In particular, distributions and capital growth are not guaranteed. Various unlisted funds are referred to in this document. At the date of this document, the funds are not offered outside of Australia and, in some cases, New Zealand. Neither CFM nor CPSL receive any fees for the general advice given in this document. Cromwell Property Group (Cromwell) comprises Cromwell Corporation Limited ABN 44 001 056 980 (CCL or the Company) and the Cromwell Diversified Property Trust ARSN 102 982 598 (DPT or the Trust), the responsible entity of which is CPSL.

A person typing on a laptop

Learn

Home Understanding commercial property
November 27, 2025

Tracking the office recovery – five charts that tell the story

Colin Mackay, Research & Investment Strategy Manager, Cromwell Property Group


After a 19-year premiership drought, the Broncos have returned to the top of the rugby league totem pole. Another redemption story, not as long in the making, is underway in commercial real estate. Office was out of favour through the pandemic, weighed down by rising interest rates, subdued liquidity, and concerns that remote work would irreparably damage demand for space. Now, conditions are improving and sentiment is becoming more positive – and the proof is in the total return pudding. Below are five charts that highlight the recovery occurring in the office sector.

1. Asset prices appear to have bottomed

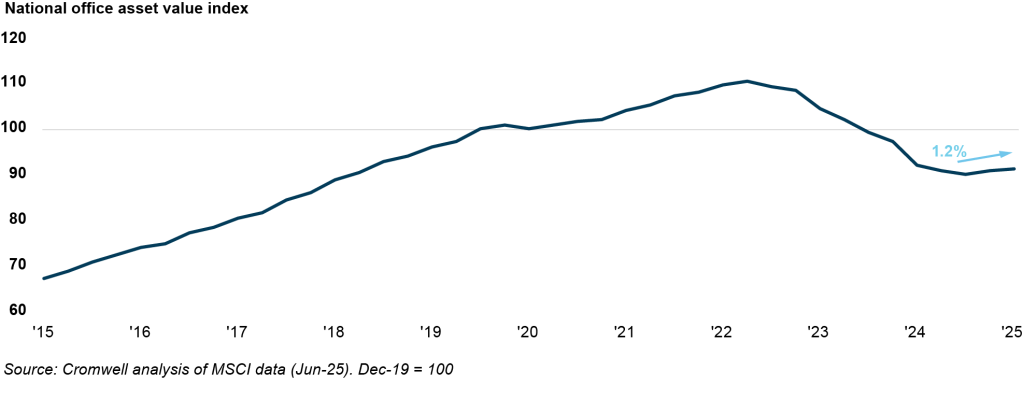
Office asset values across Australia fell -18% from late 2022 to the end of 2024. The devaluation cycle appears to have concluded, with appreciation of +1.2% recorded over the first half of 20251 . The downturn has created a compelling entry point for investors – office is currently providing a larger yield premium over the Australian 10-year Government Bond compared to the 30-year average.

The downturn has created a compelling entry point for investors – office is currently providing a larger yield premium over the Australian 10-year Government Bond compared to the 30-year average.

2. Investment performance is improving

Stable yields and ongoing income growth have contributed to an improvement in total return. Performance has been positive for the last two quarters, leading to the strongest rolling annual total return since early 2023.

3. Tenant demand now exceeds pre-pandemic levels

The income growth side of the ledger has been driven by strengthening tenant demand. Remote work did have a significant impact on occupied space in 2020, however demand has been increasing for nearly five years now. The recovery is even more impressive when split by asset quality – prime grade assets have recorded demand growth of +11% over the last five years, while demand for space in secondary assets contracted by -9%.

4. Rents are growing in most markets

Stronger tenant demand has flowed through to rents. Over the last five years, rents have increased in every major CBD market except Melbourne. Consequently, annual national CBD rent growth has been outpacing inflation since September 2024. Additionally, prime incentives are significantly higher than the long-term average in every major market, suggesting there is scope for them to fall if leasing conditions remain favourable. Decreasing incentives would provide a tailwind for income growth.

5. Future supply risk is lower than average

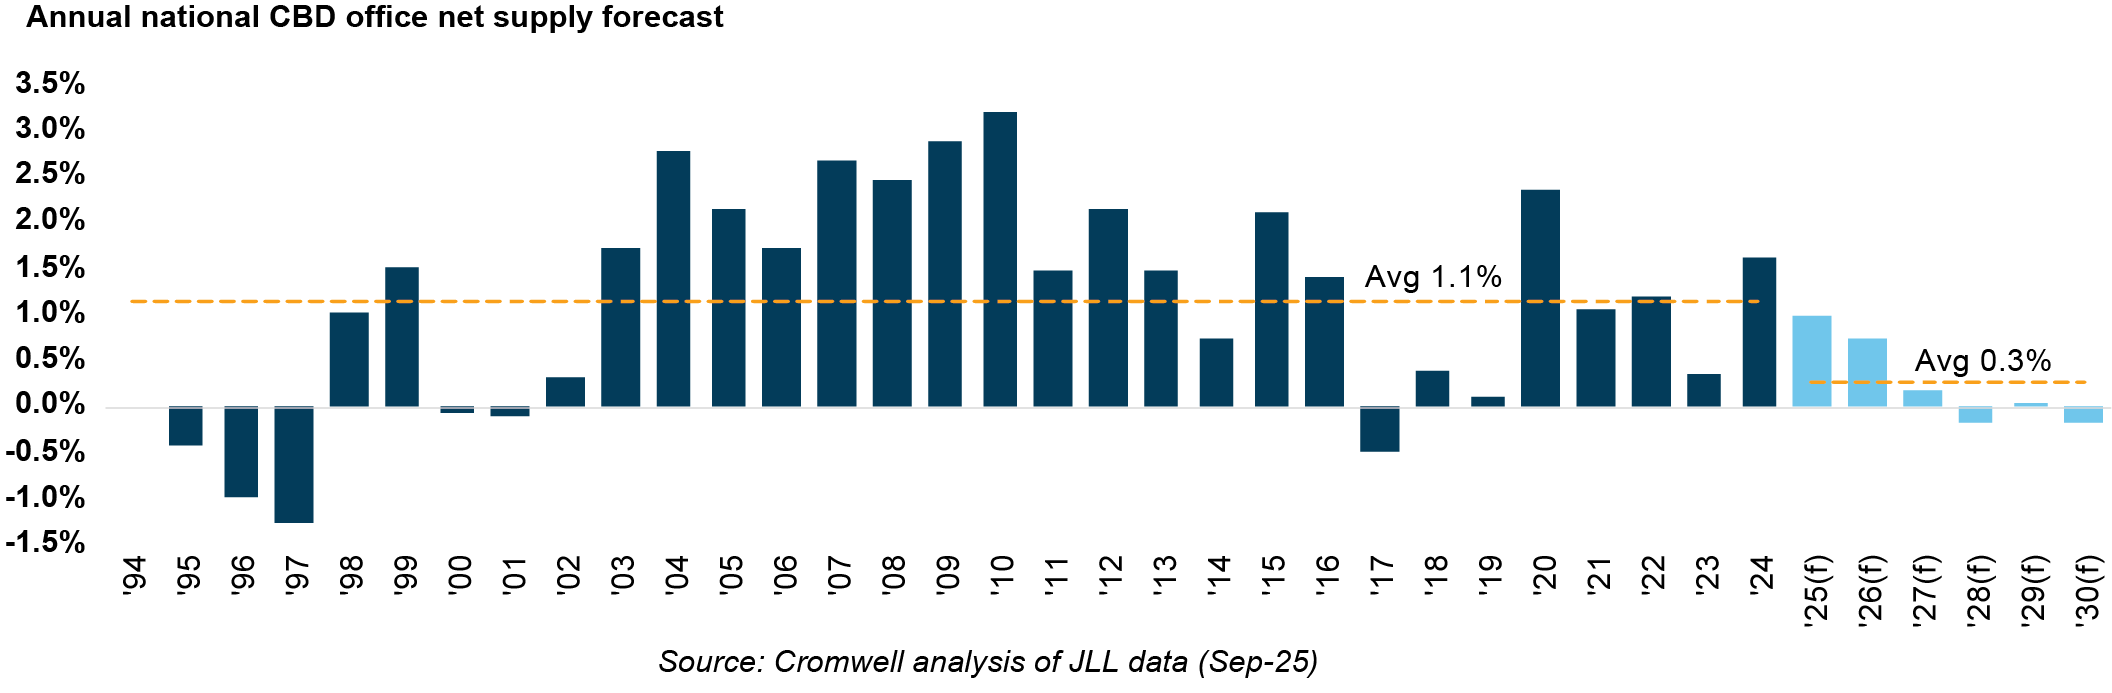
Construction is prohibitively expensive and new developments are very rarely “stacking up” in the current environment. With few projects breaking ground, the supply of CBD office space is expected to increase by only +0.3% p.a. to 2030, well below the long-term average annual rate of +1.1% and significantly lagging white collar jobs growth. A constrained supply pipeline should put downwards pressure on vacancy rates, supporting the sustainability of the recovery and the outlook for rent growth.

Heading in the right direction

While the turnaround of a real estate sector doesn’t happen overnight, multiple metrics show office is improving. For some, fear of catching a falling knife is turning into fear of missing out on the recovery upswing. With dual levers of stronger demand and weaker supply boding well for a tightening of vacancy and continued rent growth, office has every chance of topping the investment return table over the coming year.


  1. Cromwell analysis of MSCI data (Jun-25)