rebeccaquade, Author at Cromwell Property Group
A person typing on a laptop

Learn

Home Archives for rebeccaquade
October 11, 2023

Redefining the office flight to quality: A Sydney CBD case study

Colin Mackay, Research & Investment Strategy Manager, Cromwell Property Group


“Flight to quality” has been the real estate industry’s phrase of the year, particularly as it pertains to the office sector. While Cromwell agrees that a flight to quality is occurring and will continue to play out over the medium-term, our opinion of what that flight actually is – and indeed our definition of quality – is somewhat contrarian.

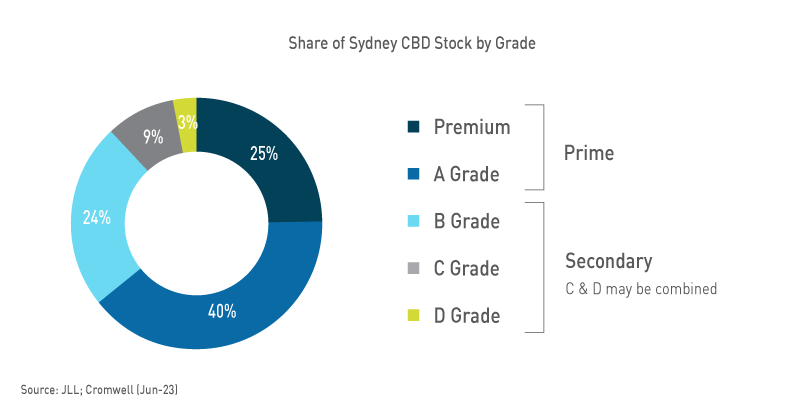
Quality has become synonymous with Premium – the top grade of office buildings. These buildings are modern developments with the largest floorplates, most internal amenity, and luxurious finishes and fitouts – and which naturally charge the highest rents. While this type of asset is an important part of the market, it’s worth assessing whether the popular narrative fits all the facts.

Are occupiers flocking to Premium assets at the expense of Secondary stock? Does the top-end of town hold all the cards?

Net absorption is important but doesn’t tell the whole story


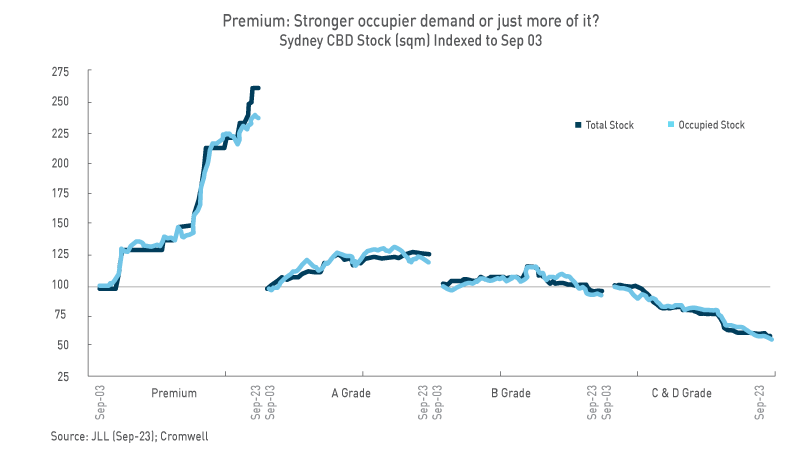
Net absorption is the metric often cited as evidence of the flight to (Premium) quality. In the Sydney CBD, Premium stock has recorded the strongest net absorption over the last 20 years at around +624,000 square metres (sqm), an increase in occupied stock of +137%. A Grade’s net absorption (+270k sqm) has been the second strongest over that time period, with the amount of occupied space increasing +18%. On face value, it’s easy to see why the “Premium is best” narrative has emerged – but there’s more to the story!

Premium has also seen the largest increase in total space.


Net absorption is the change in occupied (leased) space over a given period (often a quarter or year), represented in square metres. It is calculated by subtracting the amount of occupied space at the start of a period from the amount of occupied space at the end of a period. Positive net absorption means the amount of occupied space has increased, while negative net absorption represents a decrease.


Growth in occupied space is an expected by-product of the substantial increase in supply. On the other side of the coin, B Grade has recorded negative net absorption but also a decrease in total space – occupiers can’t lease space that doesn’t exist.

This dynamic is often seen in the lower grades as buildings are “withdrawn” (removed) from the market through conversion to different uses (e.g. residential). When we consider that rents are a function of demand and supply, it becomes clear that looking only at net absorption provides an incomplete picture of market conditions – we also need to look at the supply side of the equation.

On face value, it’s easy to see why the “Premium is best” narrative has emerged – but there’s more to the story!

Vacancy paints a different picture


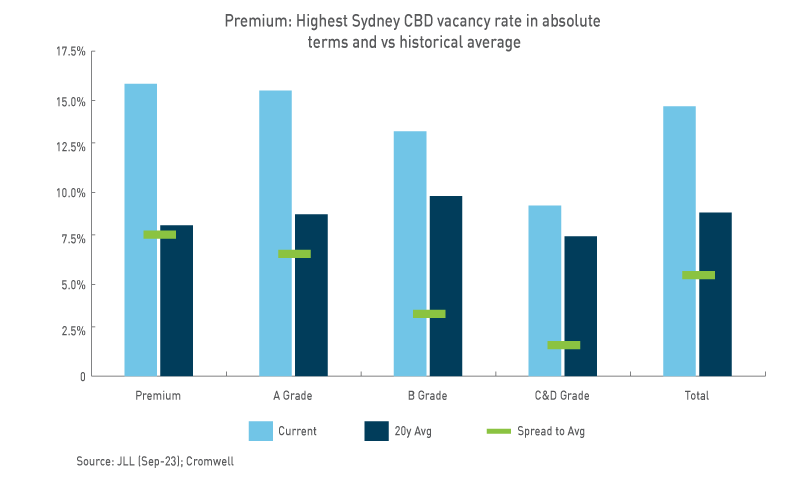
Vacancy rates highlight a deterioration of demand relative to supply at the top end of the asset grade spectrum. In the Sydney CBD, Premium has the highest vacancy rate in absolute terms and when compared to its historical average.

B Grade has proven more resilient from an occupancy perspective, with vacancy actually decreasing over the last year.


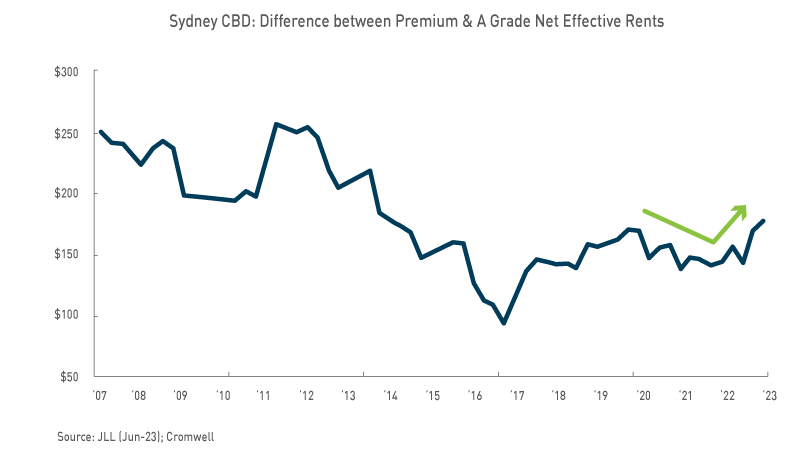
Despite elevated vacancy, Premium’s net effective rental growth has outpaced A Grade and B Grade over recent quarters. There are a couple of potential explanations for this counterintuitive result.

Time lags: It takes time for changing conditions to be grasped by market participants, for negotiations to be had and leases signed. Premium had the lowest vacancy rate until mid-2022, with its main occupiers adopting a “wait-and-see” approach to space decisions through the pandemic. Now, Premium occupiers are handing back space and driving vacancy higher, but current rental outcomes are reflecting the tight conditions of prior quarters.

Affordability: The spread between Premium and A Grade rents narrowed over 2021-22 as Premium incentives increased. Industry feedback suggests occupiers have taken advantage of the relative affordability to upgrade, taking up less space but at a higher rate per sqm. This is positive for market rental growth but less so for income growth, given the occupancy effect. We expect Premium upgrading to run out of steam as affordability worsens, with the spread recently increasing to its widest level since 2014.


Incentives are financial ‘sweeteners’ offered by landlords to encourage tenants to lease space. Common incentives include contributions to tenant fitout costs, rent-free periods, and rental abatements where the amount payable is reduced for a period of time. The rent received by a landlord after incentives are accounted for is referred to as an “effective” amount.


In any case, for investors, there’s limited value in knowing today’s performance – what really matters is the future.

Good things come in small packages


In our view, it will be difficult for Premium stock to maintain the current pace of rental growth, with A Grade stock likely to outperform over the medium-term due to lower vacancy, a less substantial supply pipeline, and favourable occupier trends.

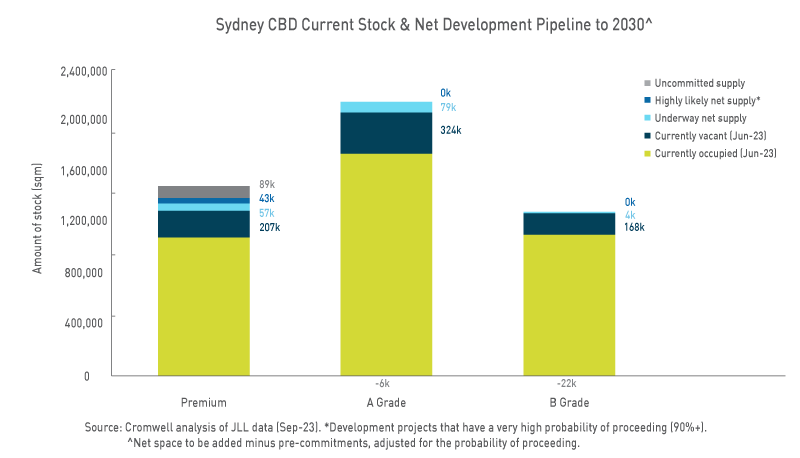
Cromwell estimates there are 265k sqm of Premium space in the Sydney CBD which will need to be leased in the near term based on space currently vacant or completing by the end of 2024. This “baked in” amount is equivalent to 19.7% of current Premium stock. Future developments may deliver new supply to the market post-2024, however we only consider 43k sqm as highly likely on a probability-adjusted basis.

A Grade has a larger amount of space requiring leasing (403k sqm); however, it is smaller as a proportion of existing stock (18.8%). Unlike excess B Grade stock which may be withdrawn from the market via change of use, the only feasible option for Premium space is absorption via leasing. On this front, the Premium end of the market faces some challenges.

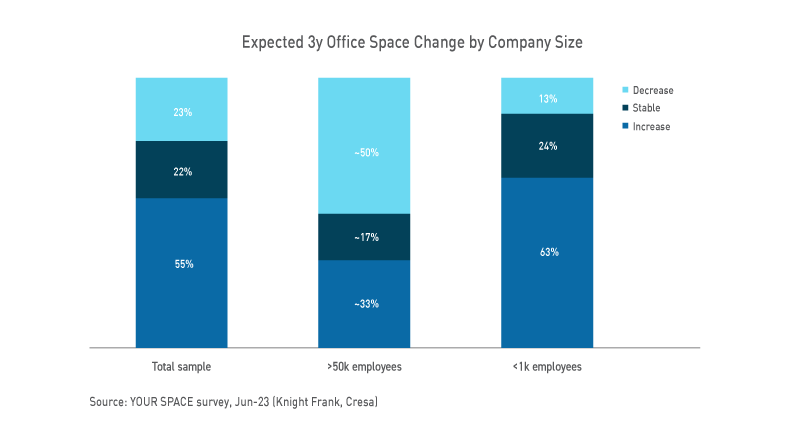
Space contraction impacts from work-from-home are being felt most keenly by assets with large floorplates. These buildings are expensive to divide into smaller tenancies and typically cater to the largest occupiers. Research1 points to an inverse relationship between occupier size and office usage, which is then being reflected in organisations’ plans to expand or contract their office footprint. The industries that predominantly occupy Premium buildings (financial services, professional services, tech) also demonstrate a lower propensity to use the office post-COVID.

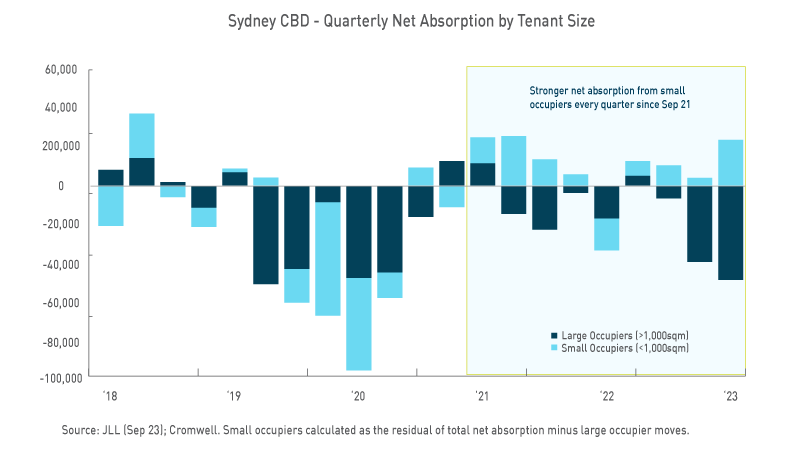
Australian leasing data corroborates the research findings. Net absorption has been far stronger across smaller (<1,000sqm) occupiers than large occupiers. The tendency to expand has also been far more positive, with smaller occupiers on average expanding their footprint by ~20% (national leasing deals from 1Q21 to 2Q22) compared to an average contraction of ~13% for occupiers larger than 3,000sqm2.

We believe the in-office bias of smaller occupiers versus larger occupiers reflects the nature of work typical across these organisations. Bigger firms are more regimented and siloed, with large administrative “back office” functions that predominantly perform focused tasks individually. These firms may have also invested more heavily in digital collaboration tools which facilitate remote work across a more geographically dispersed workforce. Smaller firms are more dynamic, with employees wearing multiple hats and undertaking work that tends to favour face-to-face interactions. Regarding smaller firms’ space expansion, this may be linked to their much stronger headcount growth through the pandemic. Businesses with 5-199 employees saw employment growth across the main office-using industries of 4.6% p.a. from Jun-19 to Jun-22, compared to -0.2% p.a. for businesses with 200+ employees3.


One of the arguments often made against exposure to smaller occupiers is that they are riskier than large occupiers, but the data shows this isn’t the case. While very small firms do fall over more often, those with 20-199 employees have nearly identical survival rates to firms with 200+ employees. The smaller occupier bracket is also broader and more diversified, with office-using businesses spanning many industries. By comparison, the large firm bracket is dominated by financial and professional services. Overexposure to large occupiers can also increase the risk that a significant portion of an asset becomes vacant at a single point in time, rather than being spread over a manageable leasing horizon.

Price doesn’t always equal quality


Conflating luxury with quality ignores the needs of many office occupiers. While the largest companies attract the most attention, most office-using Australian businesses are small and medium-sized enterprises (SMEs)4. With cost being the top driver of real estate decisions5, these SMEs are in the market for a Toyota, not a Rolls-Royce with all the extras. They want the highest quality office, in the best location, but within their price bracket. So then, what is “high quality” office? Ultimately, it’s space which meets the needs and preferences of its target occupiers.

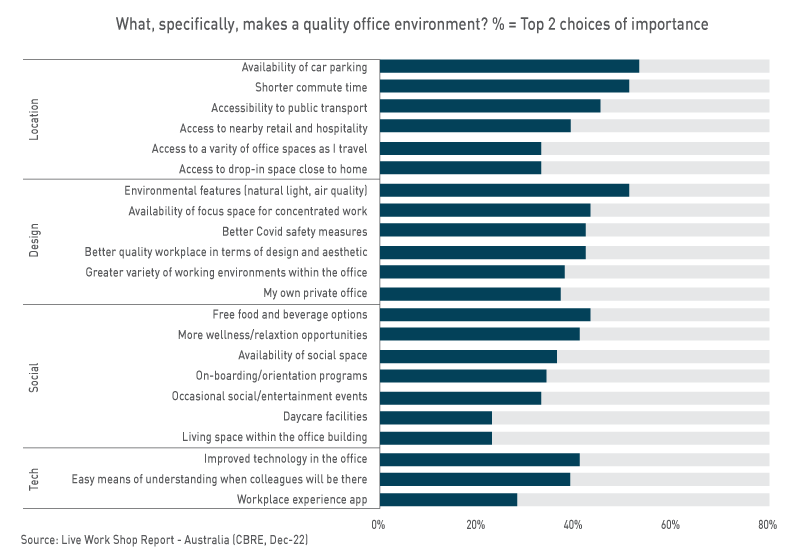
Some occupier preferences are timeless and will persist no matter how workstyles and space usage evolve, for example availability of natural light, convenient access to transport and plenty of nearby amenity (e.g. dining and gyms). These are hygiene factors valued by occupiers of any industry or size.

The pandemic has rendered some requirements less important. Floorplate size has historically been a measure of quality and is one of the criteria that determines whether a building is considered Premium or a lower grade. But with occupiers’ office usage shifting towards collaboration and social connectivity, a smaller floorplate can create more incidental interactions and a better ‘buzz’ in the office. While there is a minimum viable size in terms of efficiency and layout, we’re finding bigger isn’t always better in the eyes of occupiers.

Other requirements have increased in importance as occupiers shift to a new way of working. A greater level of embedded technology is expected, to ensure a flexible working model can be facilitated. Greater diversity of spaces is needed to support focused work, collaboration, and flexibility, with implications for building layouts and landlord-led fitouts.

Sustainability also continues to increase in importance, with a wider array of organisations focusing on both the financial and social benefits it can provide, including staff attraction and retention.

Greater diversity of spaces is needed to support focused work, collaboration, and flexibility, with implications for building layouts and landlord-led fitouts.

Not always the more sustainable choice


The preference for sustainable space is becoming more tangible and spans a variety of stakeholders, including end users, occupiers, and investors. Premium buildings often have the highest sustainability ratings (e.g. NABERS), something which is used to support the view that occupiers will increasingly gravitate to these assets over time. But again, these ratings don’t tell the whole story.

While new Premium assets are top performers from an operational emissions perspective (e.g. energy usage), production of building materials and construction activities are the largest producers of embodied carbon emissions6. As the grid decarbonises, embodied carbon’s share of built environment emissions is expected to increase from 16% in 2019 to 85% by 20506 – in the pursuit of net zero, minimising the demolition of existing buildings and the construction of new ones will become far more important than building-specific energy efficiency. As the importance of embodied carbon becomes more well known and stakeholders adopt a whole-of-life view of emissions, newly built Premium assets may not be considered the greener option.


Embodied carbon: the emissions generated during the manufacture, construction, maintenance and demolition of buildings – Green Building Council of Australia (GBCA)


Is this only a Sydney theme?

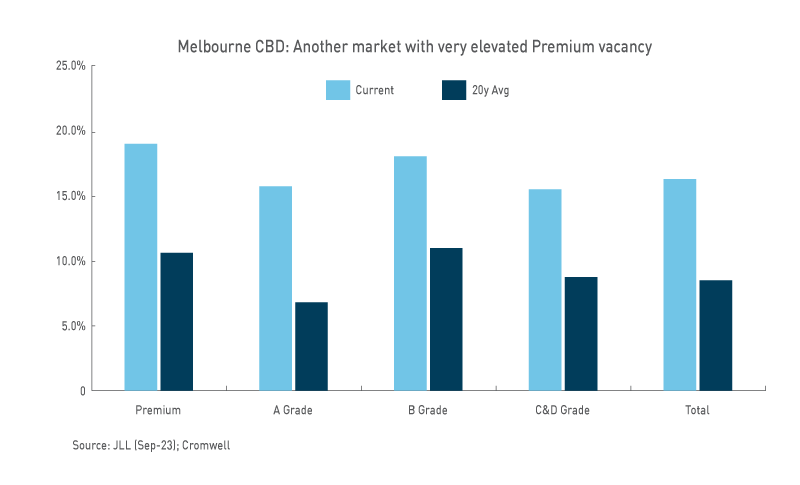
While this paper has focused on the Sydney CBD for simplicity and brevity, we see the same dynamics playing out in Melbourne. The CBD Premium vacancy rate is almost 19%, and Cromwell forecasts the amount of Premium stock will increase by 15% by 2026 based on new supply currently under construction. The same occupier trends are also occurring, with small occupiers recording positive net absorption of over +23k sqm since Dec-19, compared to negative net absorption of almost -241k sqm for large occupiers.

We believe the flight to quality is occurring across all grades – not just Premium – as occupiers seek space that is well-located, offers high amenity, and enables a flexible approach to working, but within their price bracket.

Look beyond the headline


“Flight to quality” has been a popular theme in the office sector. While positive net absorption has been used to support the notion that Premium buildings are outperforming lower grade assets, the metric can’t be looked at in isolation. Investors gain a more comprehensive understanding of market conditions by also considering other factors such as vacancy, supply impacts and occupier demand trends. We believe the flight to quality is occurring across all grades – not just Premium – as occupiers seek space that is well-located, offers high amenity, and enables a flexible approach to working, but within their price bracket. In our view, the A Grade segment of the market is best-positioned as it occupies an affordability-quality sweet spot, supported by ongoing demand from smaller occupiers and a smaller supply pipeline.


  1. Empty spaces and hybrid places (McKinsey, Jul-23); U.S. Office Occupier Sentiment Survey (CBRE, May-23)
  2. Australian Office Footprint Analysis (CBRE, Oct-22)
  3. ABS (May-23); Cromwell. Main office-using industries includes: Information media and telecommunications; Rental, hiring and real estate services; Professional, scientific and technical services; Administrative and support services; Education and training (private). Financial services employment breakdown is not published by the ABS.
  4. SMEs defined as businesses with 5-199 employees, within the same office-using industries as previously defined.
  5. What Occupiers Want (Cushman & Wakefield, Jul-23)
  6. Embodied Carbon & Embodied Energy in Australia’s Buildings (GBCA; thinkstep-anz, Aug-21)
A person typing on a laptop

Research and Insights

Home Archives for rebeccaquade
October 11, 2017

The 2017 Australian commercial property outlook

Australia has experienced a period of strong demand for commercial property which has led to firming yields and high prices. There is still a substantial amount of investment capital looking for opportunity but the lack of availability of suitable stock has led to a reduced volume of transactions during 2016. Most property markets are, or are close to being, fully valued.

Going forward, rising bond rates and slow to moderate economic growth will have an impact on property markets. As growth stays below long term trends, and rates rise, prices will soften.

In this type of environment, leasing conditions will re-emerge as the primary driver of property outcomes. The key question is the extent to which growth in net effective rental income will offset the negative impact of rising interest rates on yields.

Office property markets

Cyclical factors will have a greater influence on prices in office property markets than that of rising interest rates on yields. The key is to invest in strong leasing markets with prospects for strong rental growth.

Sydney remains the pick of the markets. Demand has been improving moderately but with development virtually stopped and stock availability declining due to the Metro rail project and increased residential conversions, falling vacancy rates have meant strong rises in effective rents as leasing incentives reduce.

Vacancy rates are forecast to be less than 5% for the next three years, driving further rises in net effective rents and property prices. However, strong capital growth over the last year has reduced prospective returns. There are still opportunities for investment, and this is the phase where repositioning, major refurbishment or new developments can generate returns, but each opportunity needs to be examined on its own merits.

Last year, demand for office space was moderate in Melbourne. But, unlike Sydney, there has been plenty of development to satisfy requirements. In the short term, Melbourne will be hit by a weakening of demand as it absorbs the loss of the remaining car manufacturers and many associated suppliers, as well as a slowdown in residential construction.

Once that shock is absorbed, however, Melbourne will recover. It still retains many of the advantages—notably cheap land for residential, commercial and industrial property—which gave it a competitive advantage over Sydney in the provision of back-office services for national operations. Melbourne office demand will grow slightly more strongly than Sydney in the next decade but rent and property value growth will be inhibited by the plentiful availability of sites.

The Brisbane economy is still suffering from the continuing loss of demand from mining services. In the boom, 25% of Brisbane’s office space was occupied by companies servicing mining. Demand will be hit further when the inner Brisbane apartment market turns down.

Medium term, the prospects are good as Brisbane will benefit from strengthening activity in tourism, education services and agriculture. The short term will be difficult due to the existing oversupply of office space with little prospect of a substantial improvement in demand to absorb it. The vacancy rate is currently above 15% and will still be above 10% at the end of the decade.

The Perth economy is collapsing under the weight of the end of the mining boom. Investment has further to fall and the economy will stay weak for some time. During the boom, half of Perth office space was occupied by companies servicing mining. Much of that demand is now gone and the vacancies will take a decade to absorb. Rents and property values will fall a lot further.

Adelaide is suffering from weak demand and oversupplied office space. Although the worst may be over in terms of demand-side weakness, there is no prospect of sustained growth for a couple of years as the local economy deals with the closure of the GM Holden plant. The patrol boats, frigates and submarines projects will help but not until the end of the decade.

Canberra remains a difficult market. We are coming to the end of the period of substantial oversupply and A grade vacancies have tightened everywhere except at the airport, where there is still plenty of space. However, new construction is about to get under way in Civic, while some secondary properties lie vacant and are difficult to lease.

Retail property markets

Regional and sub-regional centres

Retail property remains a highly popular investment. The volume of transactions reached record levels over the last few years and only a shortage of regional centres for sale has constrained the market. Some existing owners are instead now ploughing additional capital into centre refurbishment/expansion projects.

Retail yields have firmed aggressively over the last few years and are averaging around that of the last market peak. Yet retailing conditions are not nearly so strong. Growth has been slowing in trend terms since early 2014. While larger retailers and chains are outperforming smaller retailers, there have nonetheless been several high profile failures in the last few months.

The soft economy and weak household income growth will continue to constrain retail expenditure for the rest of this decade. Strong regional differences will emerge as former mining boom areas suffer, while those regions dependent on tourism, education services and other sectors that benefit from a lower Australian dollar enjoy stronger growth.

Shopping centre net operating incomes face further challenges from the poor performance of many anchor tenants and likely pressure on retailer profit margins (and hence their capacity to pay higher rent) from a lower Australian dollar. Changes in tenancy mix, a greater reliance on food and beverage retailers and service sector tenants, and costly upgrades will be required to protect against these threats.

Despite the challenges, centre incomes are, to a great extent, protected by anchor tenant rent and rents from non-expiring specialties on fixed annual escalations. Yields could remain low for some time but they will eventually follow bond rates up.

Large format retail

The large format retail property sector enjoyed another strong year in 2016 across a range of indicators. Strong demand from both consumers and retailers helped to push vacancy rates lower, in turn encouraging rental growth. Meanwhile, the investment market is buoyant.

However, the surge in consumer spending is now past and activity is at more moderate levels. This comes at a time when supply of centres is likely to surge after seven weak years. Reconfiguration of ex-Masters stores into centres could add up to 700,000 square metres of ‘new’ centre floor-space. Moreover, there are also 21 development sites to be accounted for.

Smaller existing centres and strip shopping locations are likely to be the main losers to the ‘new’ ex-Masters centres. Larger, dominant centres are unlikely to suffer as much. Bunnings is a clear winner in the whole process, with a major competitor gone and a great opportunity to pick up new sites easily.

Longer term, the outperformance of larger retailers and chains is expected to continue. Even so, it will be no match for the pace of growth in the 2000s.

On the investment side, demand remains strong. A record dollar value of transactions was achieved in 2015–16. The strength of investor demand has pushed down yields with further yield firming likely over the next 12 to 18 months. Rising bond rates, already putting upwards pressure on yields, will win out after that. Prime values are likely to stagnate rather than fall, but secondary centres could see a drop in prices.

Retail looks reasonably valued, with expected returns around current investment hurdle rates. Even so, retailing and retail property face major challenges. Large format retail has the best estimated return, reflecting its higher yield. Its low rent and expansion opportunities will help it to absorb the Masters properties and secure the longer term strength of the sector, but in the short term there are risks from the amount of reconfigured Masters floor-space likely to come on to the market.
Industrial property markets

The years of strong investment returns from industrial property are coming to an end, with the period of falling interest rates that had underwritten firming yields and strongly rising asset values now over.

Softer future yields will have a negative impact on valuations and also on construction feasibility, requiring higher pre-lease effective rents to underwrite the financial feasibility of development projects. The transition to higher rents will be relatively smooth, though the risk is that it may take a year or longer. If this occurs, falling vacancies would eventually deliver the necessary step-up in rents.

Industrial property development is running close to demand. Ready availability of land and development competition is keeping a lid on residual land prices, rents and property values, suppressing a cyclical upswing. That makes it less risky but slightly overvalued in relation to market hurdle rates.

Summary

This is an uncertain time for property investors. After a long period of falling interest rates driving firming yields, we are on the threshold of a phase of rising interest rates. The uncertainty is how quickly and by how much interest rates will rise. When they do, yields will soften but that will be offset by the impact of rising rents.

This suggests that yields may have a little further to firm before the impact of rising interest rates comes through.  Meanwhile, continuing soft economic growth means continuing weak demand, in the transition to a post-mining boom economy. The result is marked differences in performance between industries and regions. There are no obvious standout investments, and each investment opportunity needs to be examined on its own merits.

A person typing on a laptop

Research and Insights

Home Archives for rebeccaquade
July 11, 2017

Mid year 2017 economic and property outlook update

Overview

The thrust of our January 2017 Economic and Property Outlook Report (Insight, Summer 2017) remains unchanged. We still see a phase of rising bond rates coming, and a corresponding softening of yields and asset prices. This will affect all asset markets, including property. The search for yield which has been prevalent over the last few years will transform into a search for income growth.

A focus on income growth means a continued focus on the Sydney office market. The strength of the Melbourne economy means that Melbourne offices can also be considered. There may also be some emerging regional tourism-related opportunities, but Brisbane, Perth and Adelaide will remain difficult environments for investors. Asset selection, as always, is of paramount importance.

Economic update

Patchy gross domestic product (GDP) growth has confirmed our view of continued slow economic growth, a weak labour market, soft household income and retail sales and contained inflation. The structural shift from mining regions towards non-mining business-related services and regions particularly Sydney and Melbourne continues.

In Brisbane, the full impact of the fall in mining investment was delayed by a shift of resources to building inner city apartments. The impending residential apartment downturn will have a negative impact on the economy. Perth also remains weak, with further negative impact expected, as the remaining gas project finishes.

Housing interest rates have already risen through rising bank margins, particularly for investment and interest-only loans. That, together with tightening loan to valuation ratios (LVRs) and equity pre-commitment requirements on developers, will take the heat out of the high-rise residential boom. It is much harder to get a project away now. Hence the widespread recognition of the impending downturn in residential property and building markets. The negative shock of this downturn will mean continued soft overall economic growth.

Two further US Federal Reserve rate rises have also confirmed that we are embarking on a phase of rising cash and bond rates. This is particularly important for property investment markets through the relationship between bond rates and yields (see our article “Making sense of commercial property yields” in Insight, Winter 2017). In Australia, cash rates will remain low for some time. However, bond rates have already started to rise and will continue to do so in step with the US.

Property markets update:

Office markets

The Sydney office market has gone from strength to strength, with tightening leasing markets driving effective rents, firming yields and further property price growth. With strong business growth forecast to come, we believe that the Sydney office market has further to run, and even at substantially higher prices, on a five-year horizon Sydney commercial property is (broadly speaking) undervalued in relation to forecast expected returns. These conditions point to the possibility of a 1980s-style boom.

The strength of the Victorian and Melbourne economies has resulted in upgraded growth forecasts, with a flow-on to the office market. The loss of the motor vehicle industry and parts of the power industry have had an impact, but the economy and employment have been good over the last year, suggesting continued strong, albeit lower (than Sydney), growth in Melbourne.

For 20 years, Melbourne has had a comparative advantage over Sydney. Readily available and cheap land for residential, industrial and office developments has contained rents and property values, making it a more cost-effective place to situate back-office functions for national operations. That will continue to boost the demand for office space and we have increased our forecasts of demand, rent and price growth in the Melbourne market.


Development phase

The Sydney and Melbourne office markets are entering a substantial development phase which will change the logic of office investment. Over the next ten years, 3.3 million square metres (sqm) of office space in Sydney and 2.3 million sqm in Melbourne will be built. Given that some of these developments will be refurbishments, net additions will be circa 2.4 million sqm in Sydney and 1.5 million sqm in Melbourne.

This development phase and net additions of this quantum will eventually have an impact, and five year forecast returns are much stronger than ten-year forecast returns for both Sydney and Melbourne. Repositioning and exit strategies will be needed to manage this cycle.


Canberra, Brisbane, Perth and Adelaide Office

The Canberra office market should see strong prospective returns over both short and long terms. Canberra’s oversupply is easing, particularly for better quality space in Civic. However, the risk to be considered is that Canberra remains a dominant tenant, two-tiered market.

Despite strong recent sales, it is early for countercyclical investment in the Brisbane, Perth or Adelaide office markets. They face a period of weakness before they absorb the excess stock created during the boom.


Other asset classes

Amongst other property classes, weak retail sales growth and the impending arrival of Amazon have heightened emerging concerns about the strength of retailers and centre returns for retail property. The property risks are heightened for weaker centres, but returns to strong centres should remain solid.

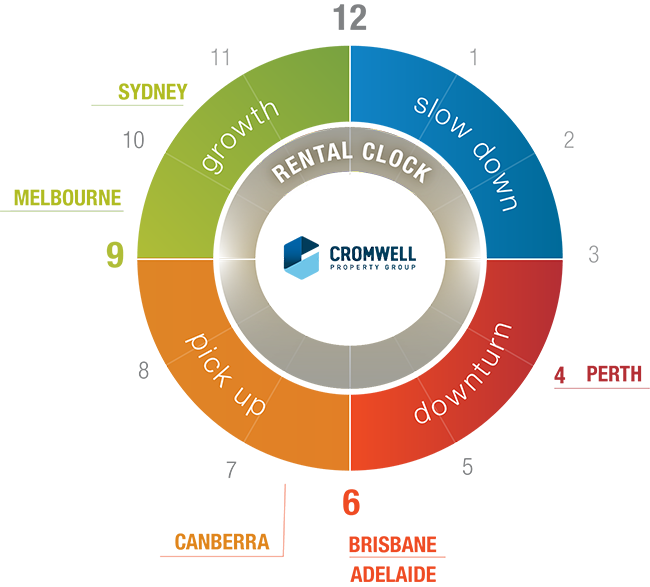
Stage of the Property cycle

Stage of the Property cycle

Industrial property is still recovering from the GFC. Availability of land is keeping development highly competitive. Recent strong returns have been driven by firming yields, allowing a reduction of effective rents and some rises in land values. Rising bond rates and softening yields will reverse this, squeezing development feasibilities and leaving returns solid but not spectacular.

The current hotels development boom is focused primarily on business travel in capital cities. The boom will oversupply business travel markets and the use of investment apartments as serviced apartments may potentially worsen matters further (think Airbnb). As recreational tourism continues to recover over the next decade however, there will be a need for more tourist hotels and services in regional markets.

During the recent period of falling interest rates, investment returns were boosted through the impact of lower rates on yields and asset prices. This happened, not just for property, but for all asset classes including infrastructure, equity markets and, of course, bonds. Rising interest rates will unwind a lot of these gains, causing a softening of yields and prices across the board.

It is now evident that we are embarking on a phase of rising interest rates worldwide, driven initially by US Federal Reserve cash rates, underpinning higher bond rates. Indeed, expectations of further cash rate rises will cause bond rates to rise by more than cash rates. It’s not yet clear how quickly or how far bond rates will rise but the recognition that they will do so will encourage investors to switch from the search for yield to a search for income growth.

Asset returns over the next five years will generally be lower than the last five. That includes infrastructure, equities and bonds, as well as property. Currently, weight of money is still driving firming pressure on yields, even in low growth markets. This will eventually change and investors should begin to look for rental growth to drive values and total returns. In that respect, the Sydney and Melbourne office markets are the obvious candidates.

A person typing on a laptop

Research and Insights

Home Archives for rebeccaquade
February 11, 2017

European property market update

Europe’s political environment has filled a lot of newspaper columns over the past 12 months. Elections and, in the case of Brexit, a referendum, have all generated volatility in financial markets. Of course while some investors see this volatility as a risk, others see it as an opportunity. It is the depth and diversity of Europe’s real estate market across a variety of countries, cities, regions and sectors which  makes it possible for investors to pursue a broad range of investment strategies, whatever their attitude to risk.


Focus on European cities

Following the UK’s decision to leave the EU last year, investment in German real estate overtook the UK for the first time, a trend which has continued into the first quarter of 2017. Despite this, London has seen increased levels of activity from Chinese investors, who continue to invest in the city, attracted by a combination of factors including the post-Brexit devaluation of the sterling and confidence that London will ultimately retain its position in the world order.

It is the strength of GDP growth in Europe’s major cities that is attractive to property investors. The dominant feature of the last 20 years has been the capacity of city economies to grow faster than the national average. Over the past decade, the three largest German cities have seen GDP growth 15% higher than the national average. London’s economy has expanded at an annual average rate of 2.9% compared to 1.2% for the UK and in Milan, growth is nearly double that of Italy.


Germany is the fourth largest economy in the world

Germany’s economy continues to grow and recorded a 1.8% rise in GDP in the final quarter of 2016, making 2016 the strongest performing year since 2011. Looking ahead to the rest of this year, GDP is predicted to grow by a further 1.5%, boosted by a recovery in exports and healthy consumer spending.

E-commerce continues to be an important driver of growth in the logistics and industrial sectors across Europe, with the popularity of these sectors particularly acute in Germany, leading to some yield compression. The country’s geographical position at the heart of Europe means that it is an important transit corridor and logistics hub for nine neighbouring countries, with more goods passing through Germany than any other country.

In 2016, take up of warehouse and logistics space totalled 6.75 million square metres, which exceeded the previous year’s record by 10%. Much of this demand (69%) was for space outside of the top five markets of Berlin, Dusseldorf, Frankfurt, Hamburg and Munich. The increased focus on regions like Stuttgart and Cologne was due to a lack of supply in the major centres.


Infrastructure in France

French GDP grew by 1.1% in 2016 and is forecast to increase to 1.4% in 2017. 2016 was also significant because it was the third year in a row that real estate investment exceeded €22 billion.

While domestic investors represent the most important source of capital in France, accounting for 67% of the total, the country also attracts capital from a diverse range of international investors: other European countries (16%), US (9%), Asia (5%) and the Middle East (2%).

The country is set to benefit from several large infrastructure projects, which are likely to create some interesting opportunities for investors, especially in the regional office markets.

These include the ongoing Greater Paris Project, which is a vast undertaking to strengthen Paris’s status as a 21st century metropolis, as well as the planned upgrade to France’s high-speed rail network (TGV), which will reduce journey times between Paris and some of the regional cities. For example, in 2017, the office market in Bordeaux is predicted to experience similar benefits to those already seen in Lyon and Marseille.


Italy has caught the eye of investors

Italy is the fourth largest country in Europe, the fifth largest exporter and the fourth largest consumer.

In the last four years, it has caught the attention of international investors. At a macro level, this is due to a more stable political environment and the implementation of much needed structural reforms. For real estate, changes to legislation have made it easier for landlords to lease property and changes to regulation have opened up the debt market to institutions other than the traditional bank providers.

While yields have tightened on traditional core assets, investors are starting to opt for more core+ and
value-add strategies, particularly in cities like Milan.

The office sector has been by far the biggest recipient of capital, followed by the retail sector. Milan is currently the most in favour with investors generally opting for large single asset purchases, while the Rome market is in recovery mode with investment levels increasing since reaching a low point in 2014.


Occupiers looking for the ‘complete’ package in the Benelux

There are some attractive opportunities in the Benelux office sector, particularly in the five core cities of Brussels, Luxembourg, Rotterdam, The Hague and Amsterdam. We have observed a polarisation in this market with some occupiers becoming focused on micro-locations as they look for the ‘complete’ package, incorporating good access to public transport and local amenities like housing and entertainment. Finding the best locations is a key issue for many occupiers as they look to retain high quality staff.

Investment volumes, specifically in the Dutch market, have been on the increase since 2012, reaching more than €14 billion in 2016. Most of this activity has been in the office sector where yields have tightened over the past two years, with up-take coming from the IT sector.


Denmark and the Nordics

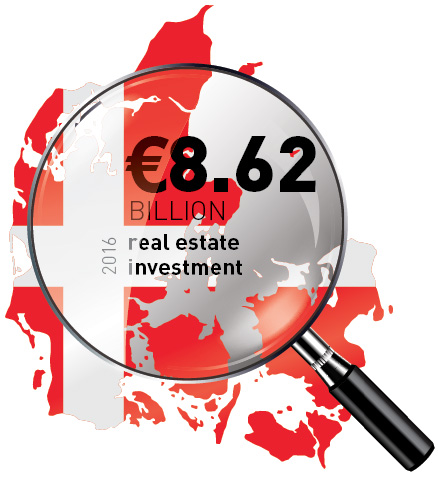
Denmark is the smallest of the Nordic countries with its population concentrated in Copenhagen. Investment into the country’s real estate market totalled €8.62 billion in 2016, of which the majority was invested in the office market.

Across the Nordics, there is a diverse return profile by region. For example, the core and value-add markets in Sweden are tightly priced, whereas in Finland there is a greater spread between core and secondary yields, which creates an opportunity to manage assets to core. A trend towards longer lease lengths in Finland has also made it more attractive to overseas institutions.


An understanding of regions and sectors is the key

The European market is broad and deep, which allows for diversification across various regions and sectors. Cromwell’s European presence is strengthened by extensive local market knowledge, which allows us to identify opportunities specific to each city, and to react to various market influences independently.

Cromwell Property Group CEO, Mr Paul Weightman believes diversity across asset classes is important for investors to get a foothold on the Europe story:

“Each market has a different fundamental. Retail in France is more challenging; Germany, we think, has been very highly priced in terms of office. In Italy, we’re just starting to see more economic activity, particularly in the north, which will flow on
to improved demand for real estate.”

Despite short-term volatility brought about by political events or fluctuations in the economic cycle, the reality for many investors is that the size and depth of the European commercial real estate market will ensure it remains an important part of their overall real estate allocation. As the investment cycle evolves, they may switch investment strategy, but familiarity with the European market and the diversity it provides will help to ensure it remains attractive.