However, in 2016, the International Monetary Fund called the Chinese economy the world’s largest when adjusted for purchasing power parity (which allows you to compare how much your money can buy in relative terms).
Perhaps a more telling statistic is that per capita disposable income is US$39,513 in the US and just US$2,993 in China. This more aptly illustrates just how far China has yet to go to give its citizens a similar quality of life.
The next two largest economies are Japan (US$4.9 trillion) and Germany (US$4.6 trillion). It’s India (US$2.6 trillion), however, which has now passed France and, given Brexit, probably also the UK, which is increasing the fastest. Brazil, despite its very recent economic woes, surpassed Italy in GDP rankings to take the number eight spot overall. Canada rounds out the top ten.
Australia’s GDP was US$1.32 trillion or 1.67% of the global economy, which just about puts it on par with Spain. While punching above Spain and most others in terms of GDP per capita, Australia remains a relatively small economy in global terms.
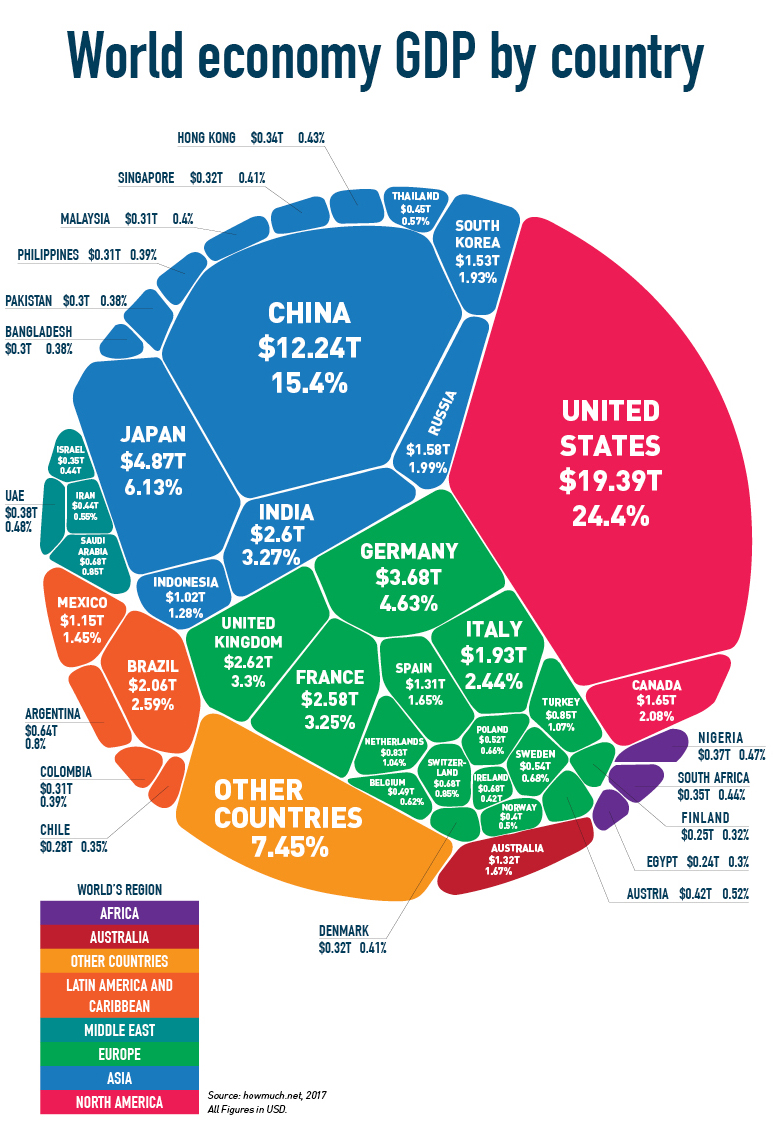
The infographic below shows the composition of the US$80 trillion global economy in 2017, the most recent year in which comprehensive figures were available. In nominal terms, the US still has the largest Gross Domestic Product (GDP) at US$19.4 trillion, making up 24.4% of the world economy, nearly 60% larger than China at US$12.2 trillion.
However, in 2016, the International Monetary Fund called the Chinese economy the world’s largest when adjusted for purchasing power parity (which allows you to compare how much your money can buy in relative terms).
Perhaps a more telling statistic is that per capita disposable income is US$39,513 in the US and just US$2,993 in China. This more aptly illustrates just how far China has yet to go to give its citizens a similar quality of life.
The next two largest economies are Japan (US$4.9 trillion) and Germany (US$4.6 trillion). It’s India (US$2.6 trillion), however, which has now passed France and, given Brexit, probably also the UK, which is increasing the fastest. Brazil, despite its very recent economic woes, surpassed Italy in GDP rankings to take the number eight spot overall. Canada rounds out the top ten.
Australia’s GDP was US$1.32 trillion or 1.67% of the global economy, which just about puts it on par with Spain. While punching above Spain and most others in terms of GDP per capita, Australia remains a relatively small economy in global terms.
Why diversify?
Australia has often been called the lucky country, given its more than 25-year run without recession. Luck, however, is not a strategy, nor is it sufficient to build a business, execute a strategy or pay distributions. Luck can run out and, diversification, whether or not it’s for personal investing or growing a business, is important.
Diversification doesn’t mean turning your back on what you know or are familiar with (Australia), but it does mean prudently assessing opportunities which can diversify investment portfolios or business income streams both by sector and by geography.
The European real estate market, for example, comprises approximately 350 million sqm of office stock, over 14 times more than the Australian equivalent. The market comprises more than 34 different individual office markets, each with more than 2 million sqm of office space.
To put it in perspective, that’s 34 different markets the size of Brisbane or Canberra that you can choose to invest in. All of these locations will have different local market dynamics, are at different points in the real estate cycle and are in differently performing countries, some of which, like Poland, currently have better prospects than Australia. Diversification matters.